1082
Proceedings of the 18
th
International Conference on Soil Mechanics and Geotechnical Engineering, Paris 2013
dry density and optimum moisture content under given
compacting energy are determined.
Step 2, produce the compacted loess like silt specimens.
Three moisture contents of 11.5%, 13.5% and 15.5% were
selected to be the initial moisture contents of compacted soil for
further experiment. At each moisture content, 4 compacting
energies of 671.2 kJ/m
3
, 1208.2 kJ/m
3
, 2013.7 kJ/m
3
and 2684.9
kJ/m
3
were used. In total, there are 12 specimens to be produced.
Step 3, the oedometer test was conducted on each
compacting specimen. The compressive pressures was 25, 50,
100, 200, 300, 400, 600, 800, 1600 kPa, respectively, and the
correspoding final settlement was recorded. Each loading
stopped when the settlement less than 0.01mm/hour.
3 TEST RESULTS AND ANALYSIS
3.1 Maximum dry density and optimum moisture content
1.6
1.7
1.8
1.9
2
5
10
15
20
25
Moisture content (%)
Dry density (kg/m3)
2684.9 KJ/m3
1208.2 KJ/m3
592.2 KJ/m3
Fig. 1 Moisture content vs. Dry density
The completely moisture content vs. dry density curve is drown
out for compacting energy of 592.2, 1208.2 and 2684.9 kJ/m
3
respectively, shown in fig. 1. Table 2 lists the maximum dry
density and corresponding optimum moisture content for given
compacting energy. Based the testing data, it can be concluded
that the maximum dry density is increasing and the
Table 2 Maximum dry density and optimum water content under
different compaction energy
Compacting energy
E
(KJ/m
3
)
592.2
1208.2
2684.9
Optimum moisture content
w
op
(%)
15.8
13.4
11.0
Maximum dry density
ρ
d
(g/m
3
)
1.78
1.87
1.95
corresponding optimum moisture content is decreasing with the
increment of compacting energy. This conclusion agrees with
that of other scholars.
3.2 Compressive property for same initial moisture content
The oedometer tests are conducted on the compacted loess like
soil specimens which were produced with 3 different initial
moisture contents and compacted under 4 different compacting
energies respectively as described in section 2.2.
0
0. 1
0. 2
0. 3
10
12
14
16
Moisture content
(
%
)
Compressive coefficient
α
1-2
(
1/MPa
)
2684. 9KJ/ m3
2013. 7KJ/ m3
1208. 2KJ/ m3
671. 2KJ/ m3
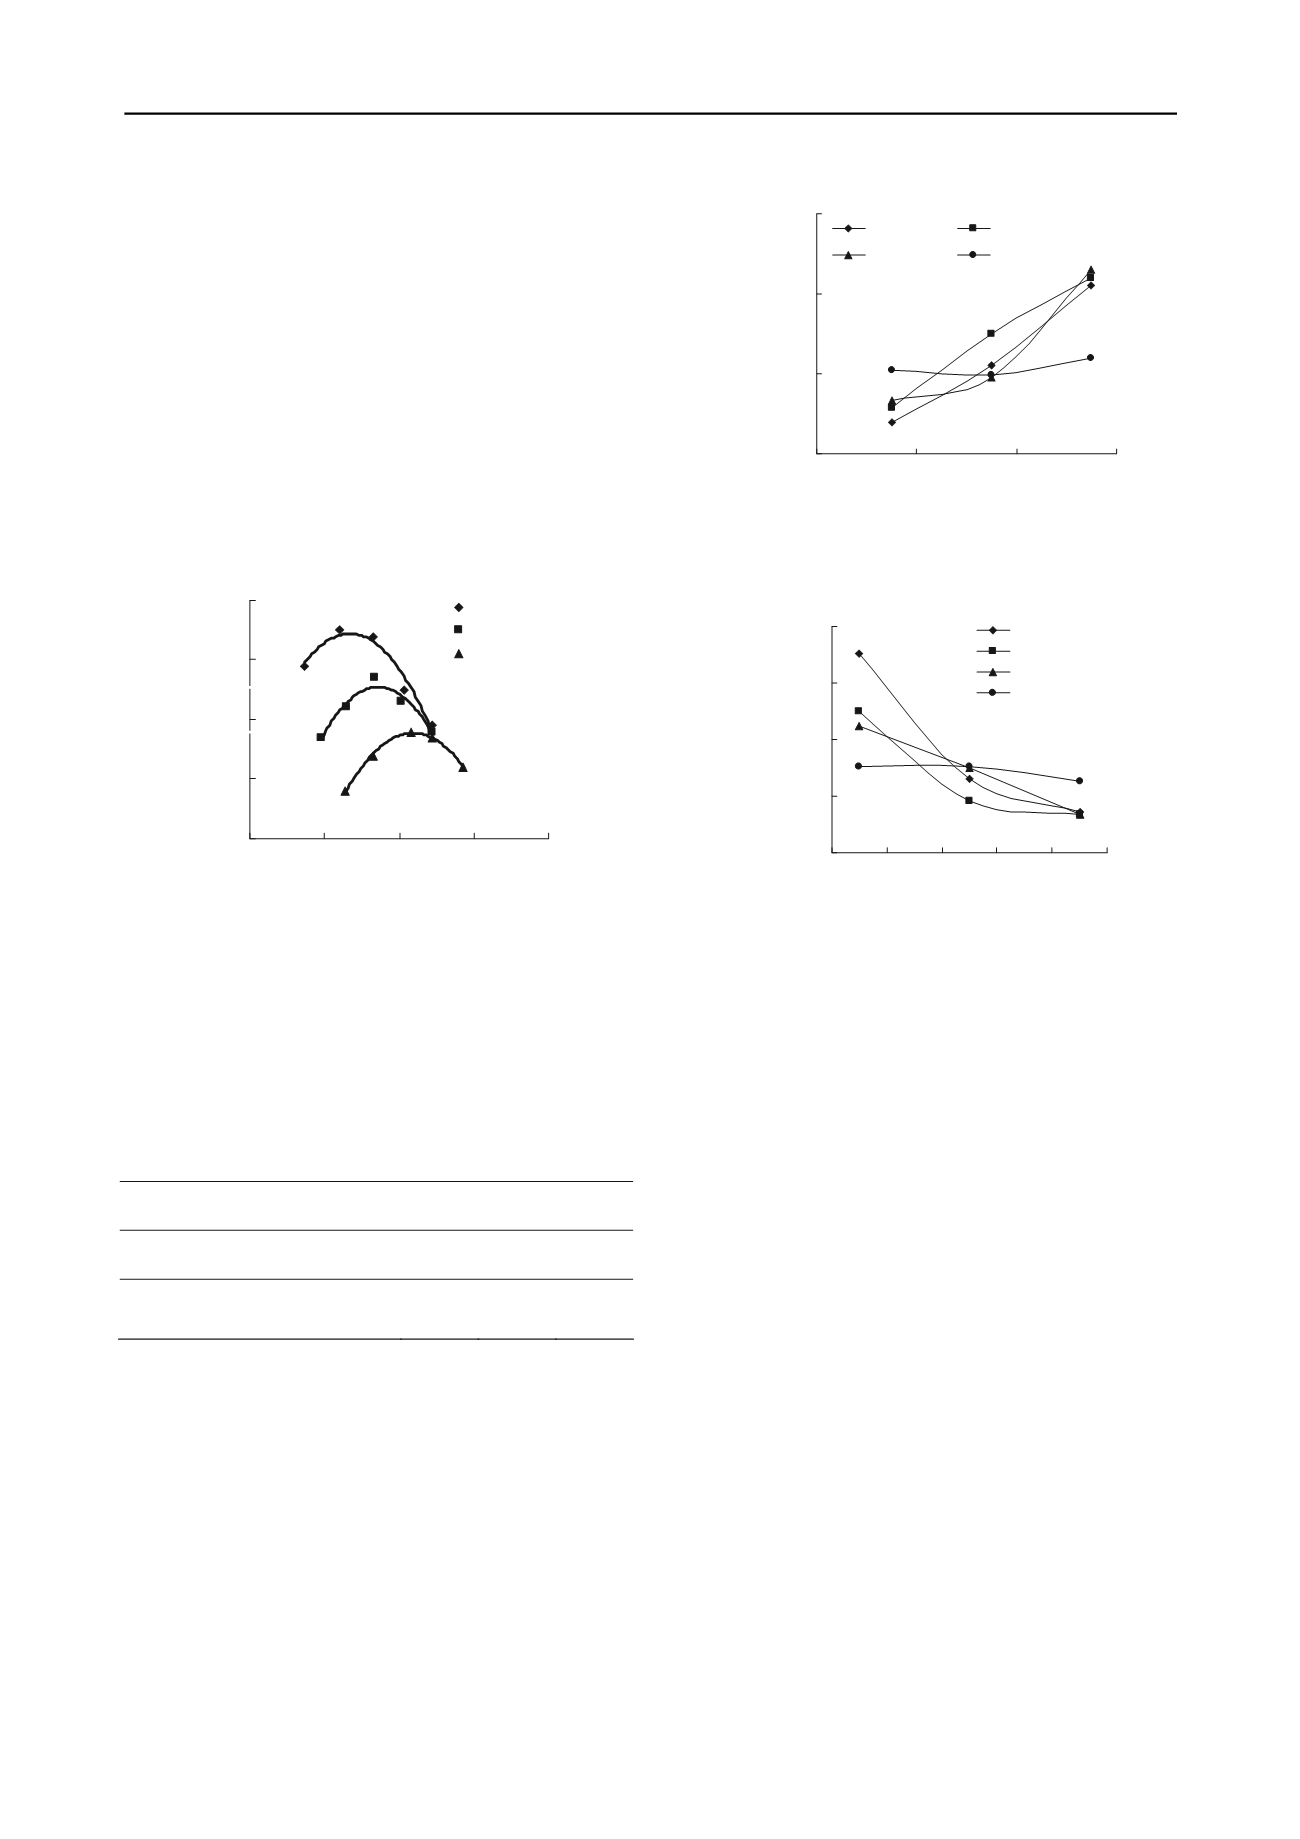
Fig. 2 Moisture content vs. Compressive coefficient under same
compacting energy
0
10
20
30
40
11 12 13 14 15 16
Moisture content
(%)
Compressive modulus
Es
1-2 (MPa)
2684. 9 KJ/ m3
2013. 7 KJ/ m3
1208. 2 KJ/ m3
671. 2 KJ/ m3
Fig. 3 Moisture content vs. Compressive modulus under same
compacting energy
Fig.2 shows the relationships of compressive coefficient and
moisture content for 4 different compacting energies. Fig. 3 is
the curves of compressive modulus vs. moisture content for 4
different compacting energies.
From figs. 2 and 3, it can be seen that for the compacted
loess like silt, the compressive coefficient increases, while the
compressive modulus decreases with the increased initial
moisture content of the specimen, when the compacting energy
is same.
When the compacting energy is smaller, like 671.2 kJ/m
3
,
the compressive coefficient and modulus change with the initial
moisture content, but the changes are smaller, the change ratio
is less than 0.25. But, when the compacting energy is greater
than 671.2 kJ/m
3
, the changes are obviously, and the change
ratio increses with the increment of compaction energy
,
shown
in figs.4 and 5. The maximum change ratio is as high as 4. This
may imply that the compressive property of compacted loess
like silt is sensitive with the initial moisture content when the
compaction energy is greater than 671.2kJ/m
3
. The greater of
the compaction energy is, the more sensitive the soil to initial
moisture content.


