1087
Technical Committee 106 /
Comité technique 106
the sample dosed with 1500 ppm of polymer appears to have a
higher shrinkage limit. From total suction measurements, the
AEV appears to be between 300 and 400 kPa, though this may
be biased by osmotic suction.
Figure 2: Shrinkage curves for polymer amended MFT
Figure 3: Void ratio and degree of saturation for polymer amended MFT
desiccating in columns
Figure 4: Water-retention curves for polymer amended MFT, from total
suction and gravimetric water content analysis on grab samples
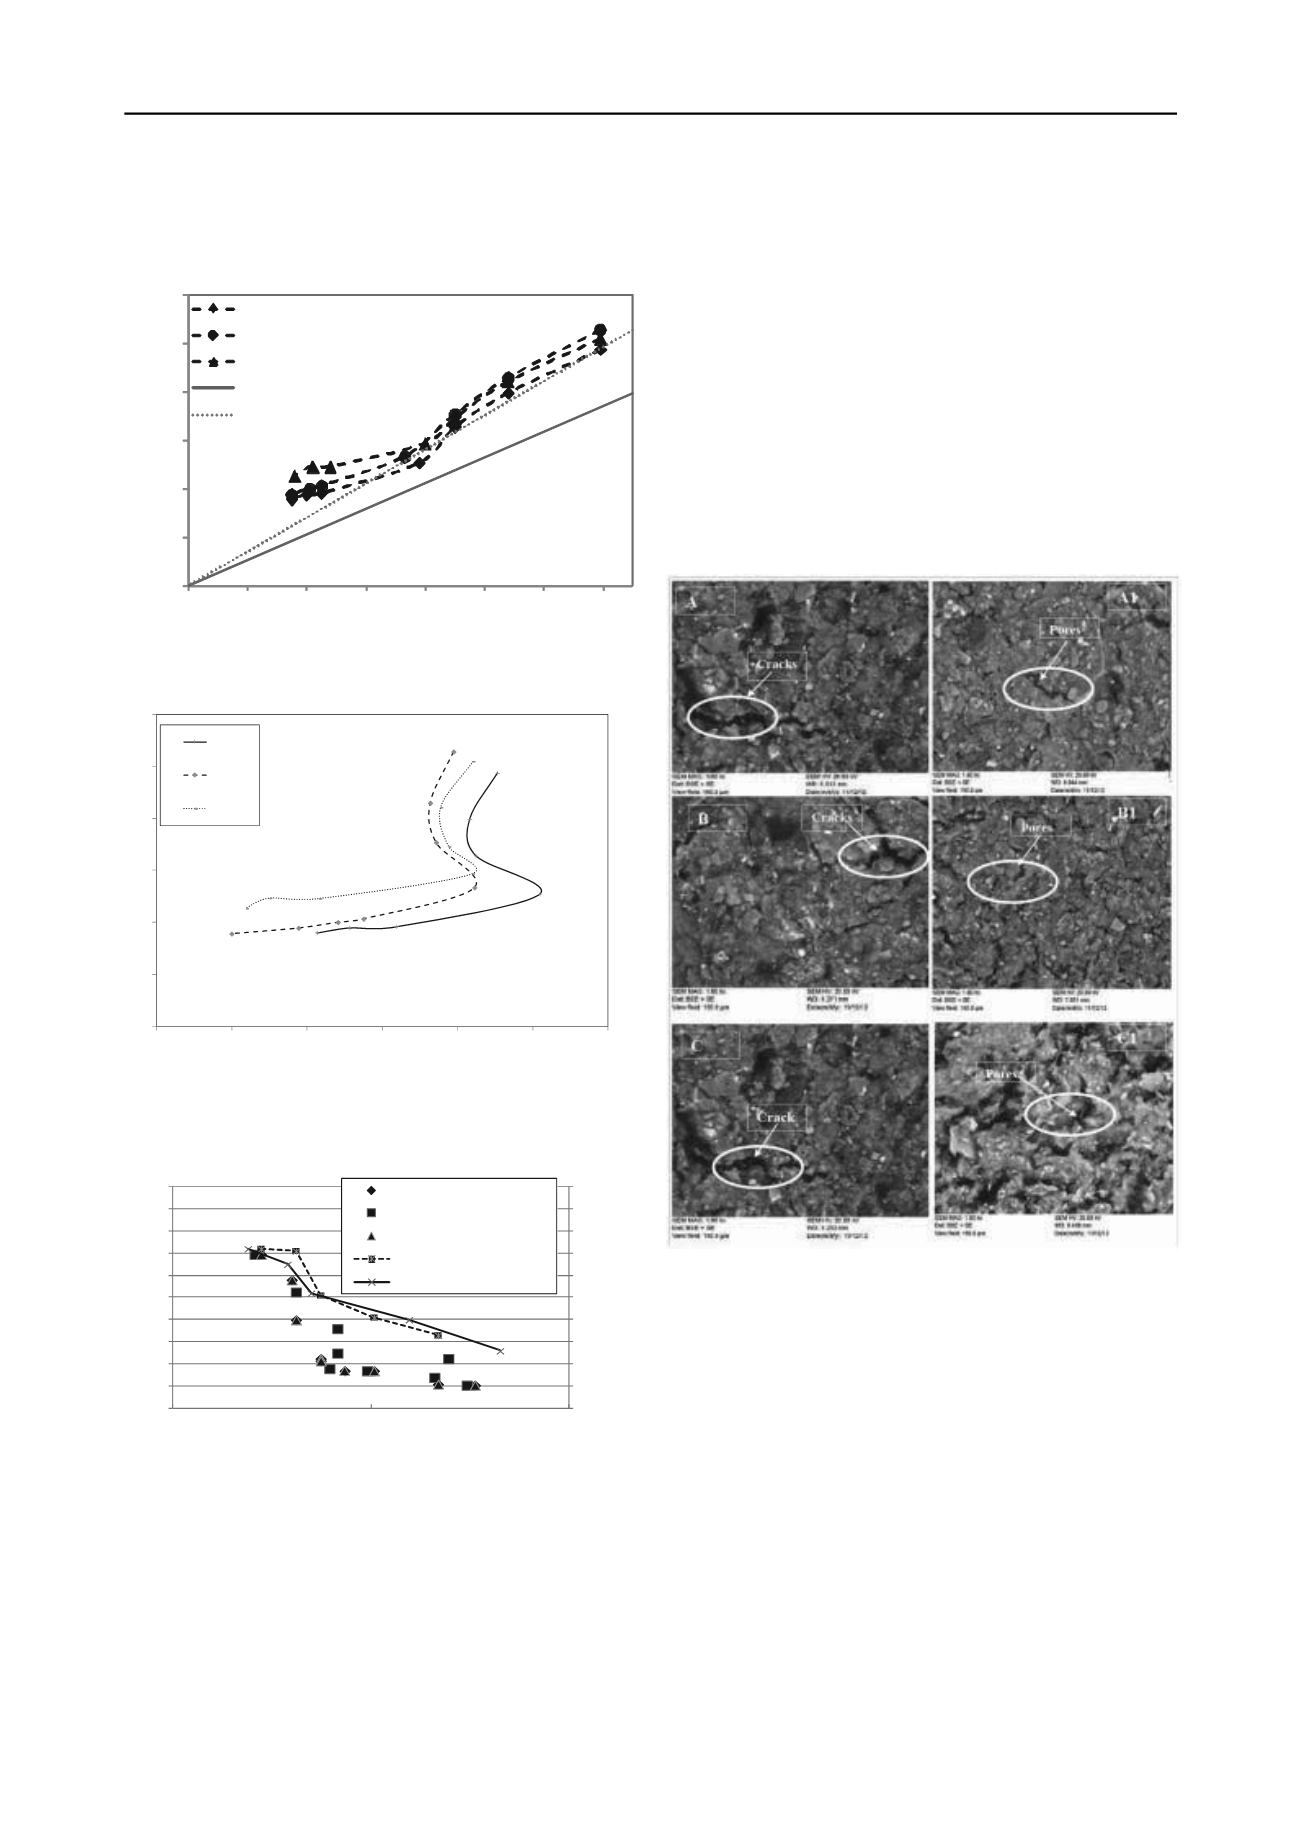
2.3 Microstructural analysis of polymer amended MFT
SEM tests were carried out adjusting the magnification of SEM
device from 0.1 k V to 5 kV and a high vacuum (10
-3
Pa) of the
vacuum chamber. A cold stage of -50
o
C was applied to all
samples for testing. Two samples for each level of polymer dose
are shown, for two different water contents of ~100 % and 50%
(+/- 5%). Interestingly, while the samples at the higher water
content appear to show differences in inter-aggregate porosity,
the differences at the lower water content are much less
apparent. In the 1500 ppm sample at the higher water content,
the shapes of the pores seem more round showing the structure
to be more flocculated than that of the other doses.
The appearance of the polymer amended MFT at lower
water contents is quite different in comparison to the images for
the higher water content samples. At the lower water contents,
there is a greater frequency of cracks. However, the difference
between samples with different polymer dose is less remarkable
than at the higher water content. Grayscale analysis (defining
porosity by a range of pixel shade) supports this qualitative
judgement.
These results, by themselves, suggest that desiccation does
substantially alter the microstructure, similar to other clayey
soils (E.G Romero and Simms 2008), and as desiccation
progresses the differences in microstructure between samples
prepared with different polymer doses become less.
0
1
2
3
4
5
6
0
0.2
0.4
0.6
0.8
1
1.2
1.4
V
oid
ratio
Water contents
700ppm
1000ppm
1500ppm
100%saturation line
75% saturation line
0
1
2
3
4
5
6
30
40
50
60
70
80
90
Void ratio
Degree of saturation (%)
700
1000
1500
Figure 5: Scanning electron microscopy (SEM) analysis of polymer
amended MFT (left; w = 50% for 700, 1000, and 1500 ppm from top to
bottom and right; w =103% for 700, 1000, and 1500 from top to bottom.
Images are 100 by 100 microns.
Cumulative pore-size distributions (CPSD) from MIP are shown
in Figures 6 and 7. Figure 6 shows the CPSD for the three
treatments of polymer amended MFT and untreated MFT at the
initial water content (140%). As expected, the treated MFT
shows much more porosity in the high pore-sizes than untreated
MFT. The treated MFT CPSD are very close together, with the
1500 ppm sample showing somewhat larger pore sizes than the
other two treatments. Figure 7 shows how the CPSD changes
with desiccation, showing the same trend as the SEM images –
there is very little difference between the samples desiccated to
100%. This agrees with the relatively small differences in the
water retention curve at high suctions – by the time the AEV is
reached (about 80 % water content in Figures 2 and 4), the
difference in microstructure and relatively small. However, the
MIP data does not apparently explain the slightly higher
shrinkage limit of the 1500 ppm treatment.
0
10
20
30
40
50
60
70
80
90
100
0
20
40
60
80
100
120
140
160
180
200
0.1
1
10
Degree of saturation
Water content (%)
Total suction (MPa)
700
1000
1500
700 ‐Degree of saturation
1500 ‐Degree of Saturation


