1086
Proceedings of the 18
th
International Conference on Soil Mechanics and Geotechnical Engineering, Paris 2013
freeze-drying, by first cooling pentane in liquid nitrogen, then
submerging the soil samples (cubes less than 5 mm in all
dimensions) by using either a small strainer, or a miniature tray
for very wet samples (MFT with no polymer) in the pentane for
1 minute. Soil samples are subsequently dried under vacuum for
1 hour, prior to the the actual MIP test. The porosimeter model
was AutoPore IV 9500.
1.2 Scanning electron microscopy (SEM):
We employ backscattered scanning electron microscope (SEM)
using a rapid freezing stage (-50 degrees C) before application
of vacuum (10
-3
Pa). Grayscale pixel analyses are used to
quantitatively compare SEM images.
1.3 Total suction measurement
Total
suction
measurements
used
chilled
mirror
hygrometer(Wenglor WP4PotentiaMeter). Such hygrometers
measure the vapour pressure in porous media, by decreasing the
temperature in a confined space with the sample, until water
condenses on a mirror. Thus the saturated vapour pressure at
this controlled temperature is known, which equal to the vapour
pressure at the ambient temperature of the sample. The relative
humidity is equated to total suction, based on the well-known
Kelvin-Laplace equation. The range of this device is
theoretically from 0 up to 500 MPa of total suction, but
precision is limited to 0.1 MPa. Sample must be extracted from
the porous media and placed in a container for insertion in the
WP4 device.
1.4 Material and Experimental set up:
MIP and SEM techniques are applied to oil sand mature fine
tailings (MFT) amended with different does of polymer, along
with measurement of volume change, desaturation, and total
suction in shallow columns (0.30 m in initial height, 0.30 m
diameter), exposed to potential evaporation rates of ~ 6 mm
/day. Columns were kept on scales, and vertical volume change
was estimated by a plumb line dropped on 8 different points on
each column. The MFT and polymer were supplied by Shell
Canada. The specified MFT is originally at 35 - 40% solid
contents (gravimetric water of 135 - 145%). The polymer
(Flopam DPR 5285) is mixed into diluted MFT using a paint
mixer set to 260 rpm, mixing for 30 seconds – this regime is to
reproduce similar mixing conditions to in-pipe mixing that
occurs during field trials of polymer-amended MFT deposition
at Shell’s Muskeg River Mine. Three columns have three
different doses of poylmer - 700 ppm of the solid contents, 1000
ppm, 1500 ppm.
2 TEST RESULTS AND DISCUSSIONS
2.1 Basics properties of raw MFT
Table 1 presents some basics characteristics of raw MFT
Table 1: Basics characteristics of raw MFT
Parameter
Value
Parameters
Value
Water contents (%)
14158
SFR
0.1
Solid contents (%)
40%
Liquid
limit
45
Density (kg/m
3
)
1100-
1200
Plastic
limit
19
Specific gravity
2.64
Liquidity
index
3.96
These values are in close agreement to other studies of MFT,
such as in Jeeravipoolvarn (2005).
2.2 Dewatering / desiccation behaviour of polmer amended
MFT
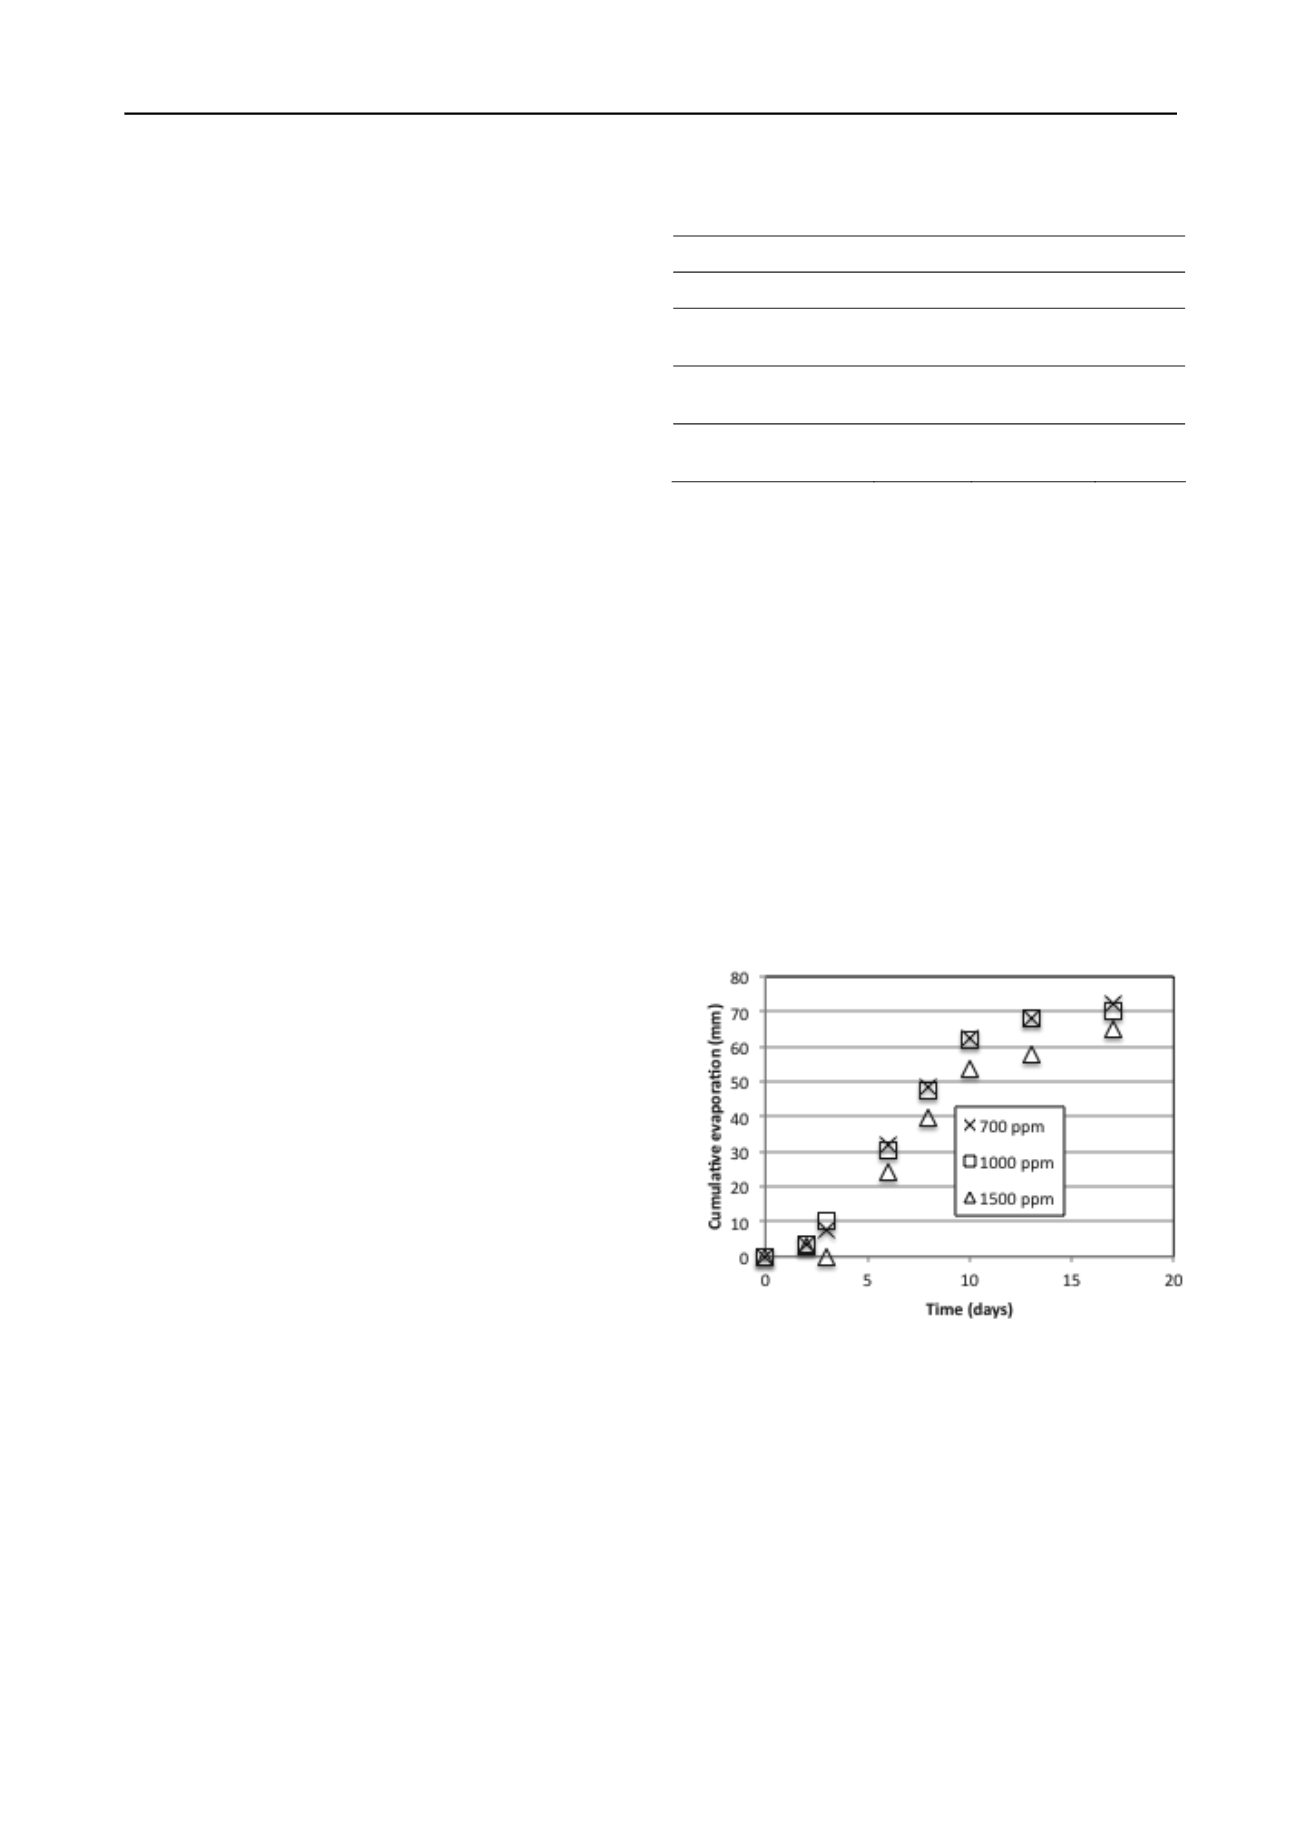
As shown in Figure 1, evaporation proceeds at the potential rate
of ~ 6 mm /day, until about Day 10. This corresponds to an
average water content of 50%, or a solids concentration of 67%.
At this water content, polymer amended MFT will have a peak
undrained shear strengths in excess of 5 kPa (Matthews et al.
2011). For this relatively short layer thickness (0.30 m initial
height), the drying is quite uniform with depth. Total suction
values near the (~5 mm) surface increase above 1 MPa at this
point (10 days), correlating with the onset of Stage II drying
(actual evaporation declines significantly compared to potential
evaporation). As described in Wilson et al. (1997). evaporation
declines as a function of total suction at the soil surface, the
decine becoming significant for total suctions in excess of 3
MPa.
Figure 1: Cumulative evaporation in polymer amended MFT columns
Volume change behaviour is shown in Figure 2 (the shrinkage
curve) and in Figure 3 (showing relation between degree of
saturation and void ratio). Void ratio and degrees of saturation
are based on vertical volume change only. Therefore, the initial
degree of saturation are somewhat lower (70% initially) than the
true value. This low value is also due to large aggregates formed
by the polymer, resulting in some significant macroporosity that
drains within the first few hours. Figure 3, however, clearly
shows when the air entry value (AEV) occurs and the expected
subsequent decreasing rate of volume change. Plotting total
suction versus water content data from the same samples, and
converting water content to degree of saturation using volume
change data, a rough water-retention curve (WRC) can be
obtained for the MFT with different does of polymer (Figure 4).
Generally, the WRC and the volume change behaviour are very
similar between the different treatments, with the exception that


