905
Technical Committee 104 /
Comité technique 104
were embedded in backfill at 100 mm, 300 mm and 500 mm
from bottom and one accelerometer was mounted directly on
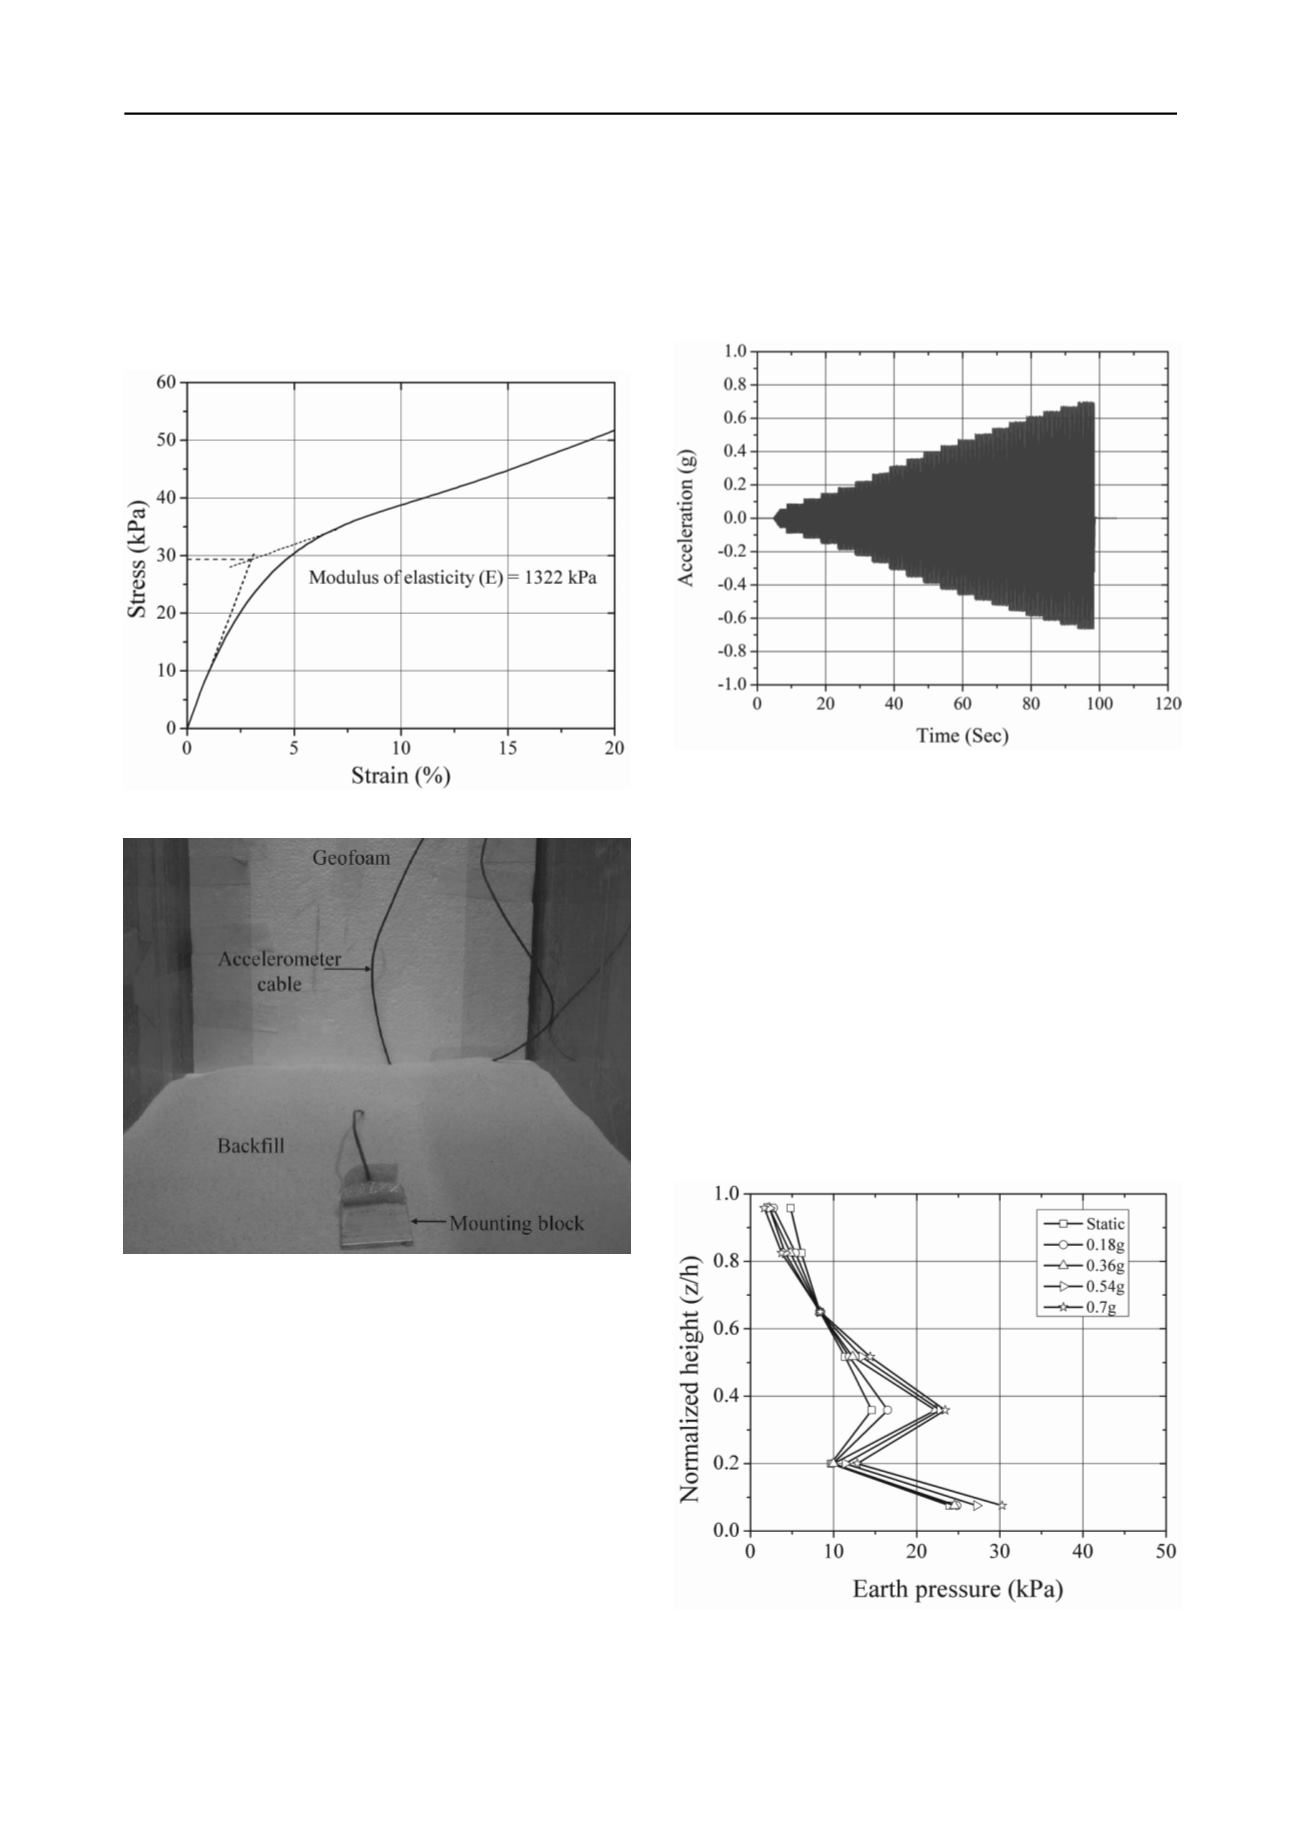
the shaking table to record the input base acceleration–time
excitation history, as shown in Fig. 1. The accelerometers were
attached to mounting blocks before placing them at desired
locations, to ensure that the devices remained level and moved
in phase with the surrounding sand during shaking, as shown in
Fig. 4.
Figure 3. Stress-strain behavior of 10D EPS geofoam
Figure 4. Positioning of Accelerometer in the backfill
The instruments were monitored by a separate high speed data
acquisition system (MGC plus – HBM Inc. and Catman
professional software). Data from a total of 17 instruments were
recorded at a speed of about 100 Hz in order to prevent aliasing
and to capture peak response values. After the model
preparation was completed, surcharge pressure was applied in
increments of 10 kPa up to 50 kPa and corresponding
magnitude and distribution of earth pressure were monitored.
Further, under maintained surcharge pressure, models were
excited using a displacement–time history selected to match a
target stepped-amplitude sinusoidal accelerogram with a
frequency of 3Hz as shown in Fig. 5. The acceleration record
was stepped in 0.045 g increments and each amplitude
increment was held for 5 s. The maximum base acceleration
was 0.7 g. The above frequency was adopted, as frequencies of
2–3 Hz are representative of typical predominant frequencies of
medium to high frequency earthquakes (Bathurst and Hatami
1998) and fall within the expected earthquake parameters for
North American seismic design (AASHTO, 2002). This simple
base excitation record is more aggressive than an equivalent
true earthquake record with the same predominant frequency
and amplitude (Bathurst and Hatami 1998, Matsuo et al. 1998).
The models were only excited in the horizontal cross-plane
direction to be consistent with the critical orientation typically
assumed for seismic design of earth retaining walls (AASHTO
2002).
Figure 5. Stepped-amplitude sinusoidal excitation input
4 RESULTS AND DISCUSSION
Experimental evaluation of earth pressure under combined static
surcharge and seismic acceleration was carried out for model
tests without and with geofoam inclusion. In this paper, results
of model tests with 10D geofoam are compared with
experiments without geofoam. For the sake of brevity, earth
pressure results corresponding to the maximum surcharge load
of 50 kPa and seismic loading are only presented here. Under
static surcharge load, observed earth pressure distribution was
approximately triangular in shape as shown in Fig. 6. However,
just above the base of wall, lower earth pressures were
observed, this may be due to arching of backfill soil.
Experimental evaluation of seismic earth pressure on retaining
wall by application of seismic acceleration revealed reduction in
the earth pressure in top 1/3 portion of wall, while increase for
remaining wall height as shown in Fig. 6.
Figure 6. Earth pressure distribution for experiments without
geofoam inclusion
During seismic loading, top portion of the wall might have
moved sufficiently to achieve active condition, showing


