897
Technical Committee 104 /
Comité technique 104
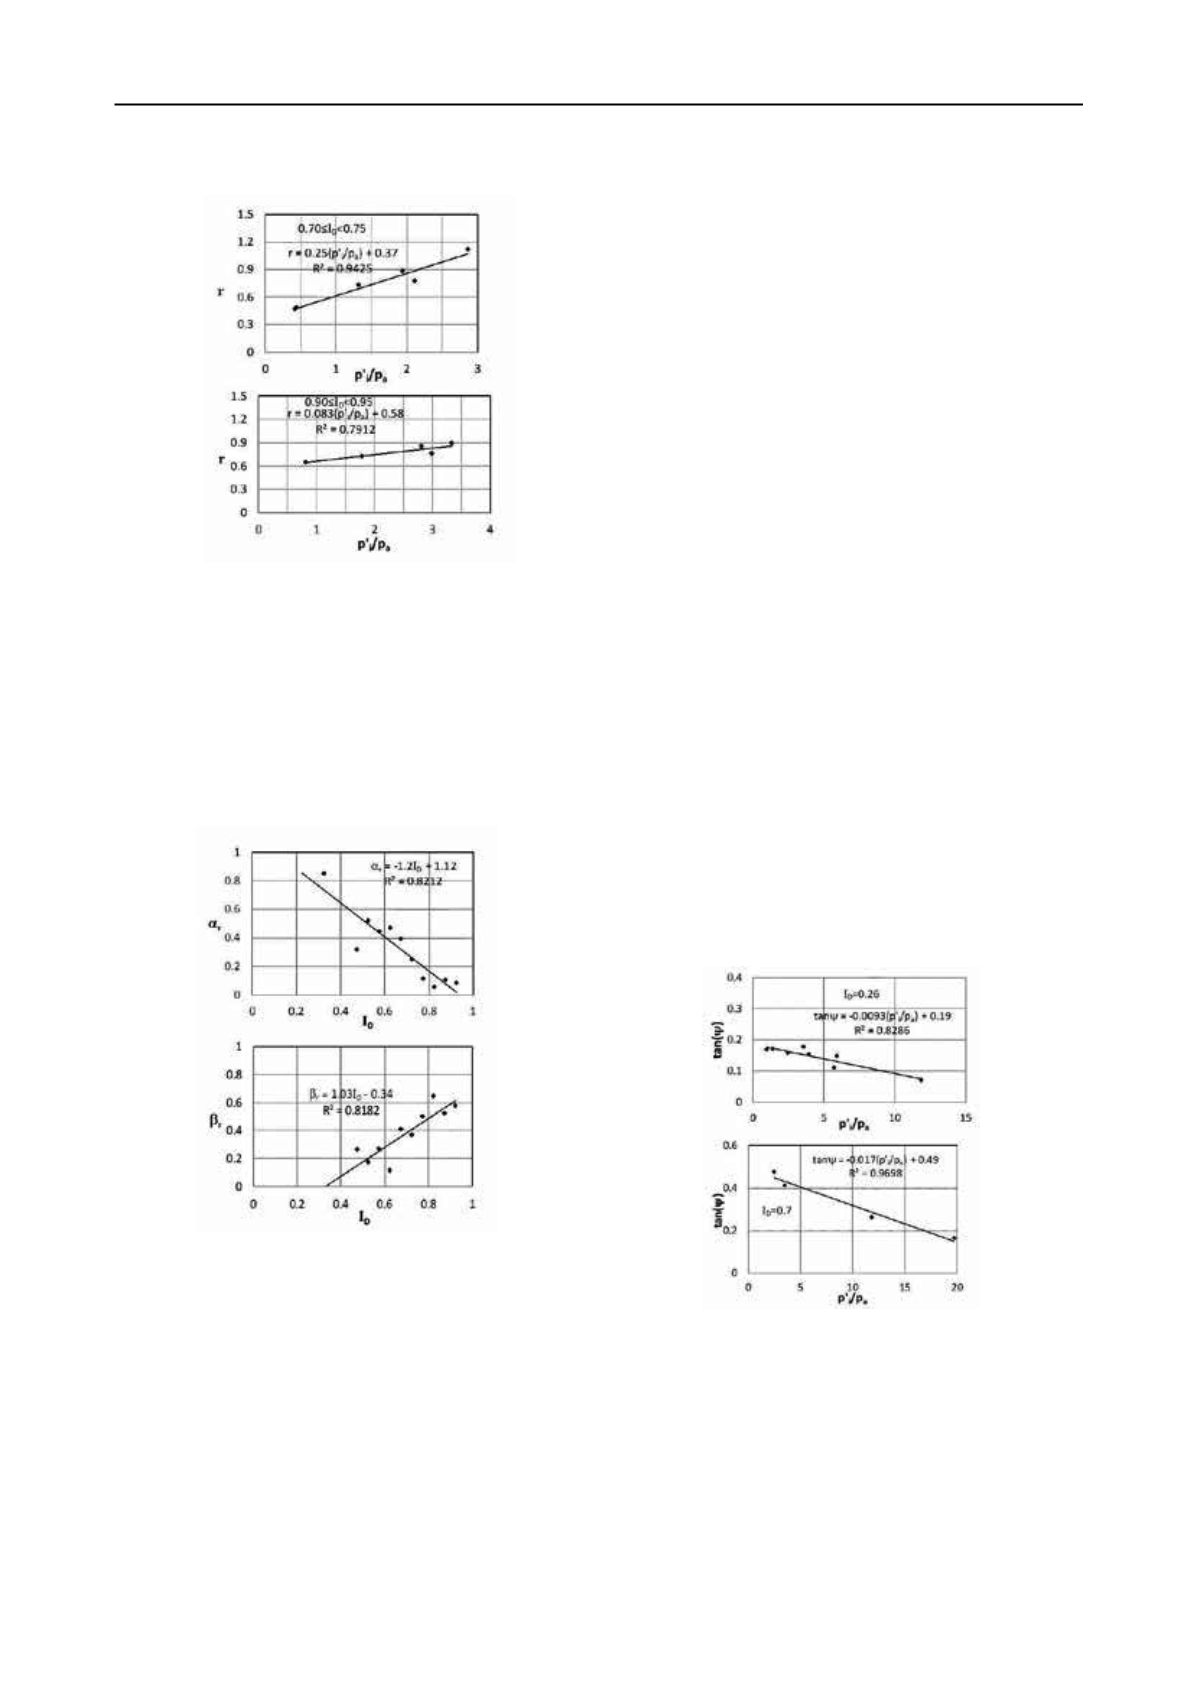
Figure 3. r-(p
′
i
/p
a
) relationships for two different ID ranges of Silivri
Sand with Ottawa grading.
As it can be observed in Figure 3, obtained r-(p
′
i
/p
a
)
relationships are approximately linear. Therefore, the
relationships are defined using a line equation.
=
′
⁄ +
(10)
Similar to Eq. 4,
α
r
and
β
r
are line-fitting parameters.
Variations of
α
r
and
β
r
with I
D
are given in Figure 4.
Figure 4.
α
r
-I
D
and
β
r
-I
D
relationships for Silivri sand.
The
α
r
-I
D
and
β
r
-I
D
relationships are approximately linear.
Therefore, they are defined as
=
+
(11)
=
+
(12)
Parameters a
r
, b
r
, m
r
, and n
r
are line-fitting parameters.
Combining Eq. 10, Eq. 11, and Eq. 12, the overall function for
calculating r is obtained.
=
+
′
⁄ +
+
(13)
For the Silivri sand with Ottawa grading, the parameters of
Eq. 13 are as follows: a
r
=-1.2, b
r
=1.12, m
r
=1.03, and n
r
=-0.34.
These values are obtained from Figure 4.
4 EVALUTION OF THE PROPOSED FUNCTIONS
The proposed equations (Eq. 8 and Eq. 13) were developed by
investigating the results of the tests conducted on Silivri sand
with Ottawa grading. Therefore, it is necessary to evaluate the
proposed equations against data sets of different soils. However,
it is very difficult to find a complete data set that provides
sufficient number of p
′
i
-I
D
-
φ′
-
ψ
combinations. Fortunately, Vaid
and Sasitharan (1992) conducted a broad triaxial testing
program on Erksak sand. Erksak sand has C
u
=1.8, e
max
=0.775,
and e
min
=0.525. Evidently, it is more uniform than Silivri sand
with Ottawa grading.
The goal of their research was to identify the effects of stress
path and loading direction on the strength and dilatancy of
sands. Accordingly the researchers conducted tests with 10
different stress paths. One of the stress paths is the same as the
tests of this program; Conventional drained triaxial compression
test on consolidated sand. However the samples were
isotropically consolidated. But, the data set of this test provided
an invaluable source against which to evaluate the proposed set
of equations.
Vaid and Sasitharan (1992) conducted their tests at three
different relative densities and under several different confining
pressures. All relevant tests, except the tests with p
′
i
>2000kPa,
are used for the evaluation of the equations. The reason for
discarding the results of the tests with p
′
i
>2000kPa is to prevent
the possible grain-crushing mechanism from altering the results.
As a result, again for each I
D
, it is observed that tan
ψ
-(p
′
i
/p
a
)
relationships are approximately linear (Figure 5). At this point,
it is interesting to note that tan
ψ
-(p
′
i
/p
a
) relationships were even
more linear when the tests with p
′
i
>2000kPa were considered.
Figure 5. Tan
ψ
-(p
′
i
/p
a
) relationships for two different I
D
values of
Erksak sand.
For Erksak sand, the variations of
α
ψ
and
β
ψ
of Eq. 4 are
obtained from Figure 6. Clearly the relationships have the same
form as in the case of Silivri sand with Ottawa grading.


