900
Proceedings of the 18
th
International Conference on Soil Mechanics and Geotechnical Engineering, Paris 2013
structures restrained at the top and bottom in medium-dense, dry
Sand, at a spin acceleration of 60g. The testing plan for the first
phase of the investigation is summarized in Table 1.
Table 1. Centrifuge Testing Plan (First Phase)
Test
# Structure Model
Soil
Type
Soil
Relative
Density
(D
r
)
Soil Cover
on Tunnel
1
None
2
Simple Equivalent
Prototype (SEP)
1.5 m
3
None
4
SEP (model fixed
to the container
base)
1.5 m
5
None
6
Stiff SEP
1.5 m
7
None
8
Flexible SEP
Nevada
Sand
60%
1.5 m
2.2.1
Model Container
A transparent FSB-type container (Fig. 1) was developed by
Ghayoomi et al. 2012a,b) to enable better visualization of the
response of underground structures . The container consists of a
stack of transparent, rigid frames separated by soft rubber,
bonded together with high strength epoxy. The combination of
rigid frames and soft rubber provides a soft and flexible lateral
deflection response during 1D horizontal shaking (Divis et al.
1996). In this manner, the container does not contribute
additional stiffness to the soil layer.
To characterize the response of the empty container, it was
placed on a dynamic shaking table mounted on the centrifuge
platform and spun up to 60g of gravitational acceleration. Next,
a series of sine-sweep motions were applied to the base of the
container in flight. The frequency response function of the
container was calculated using the power spectral ratios of the
accelerations measured using accelerometers mounted
horizontally on each of the frames. The fundamental natural
frequency of the empty container was 40 Hz at a centrifugal
acceleration of 60g (Figure 2), confirming the soft response.
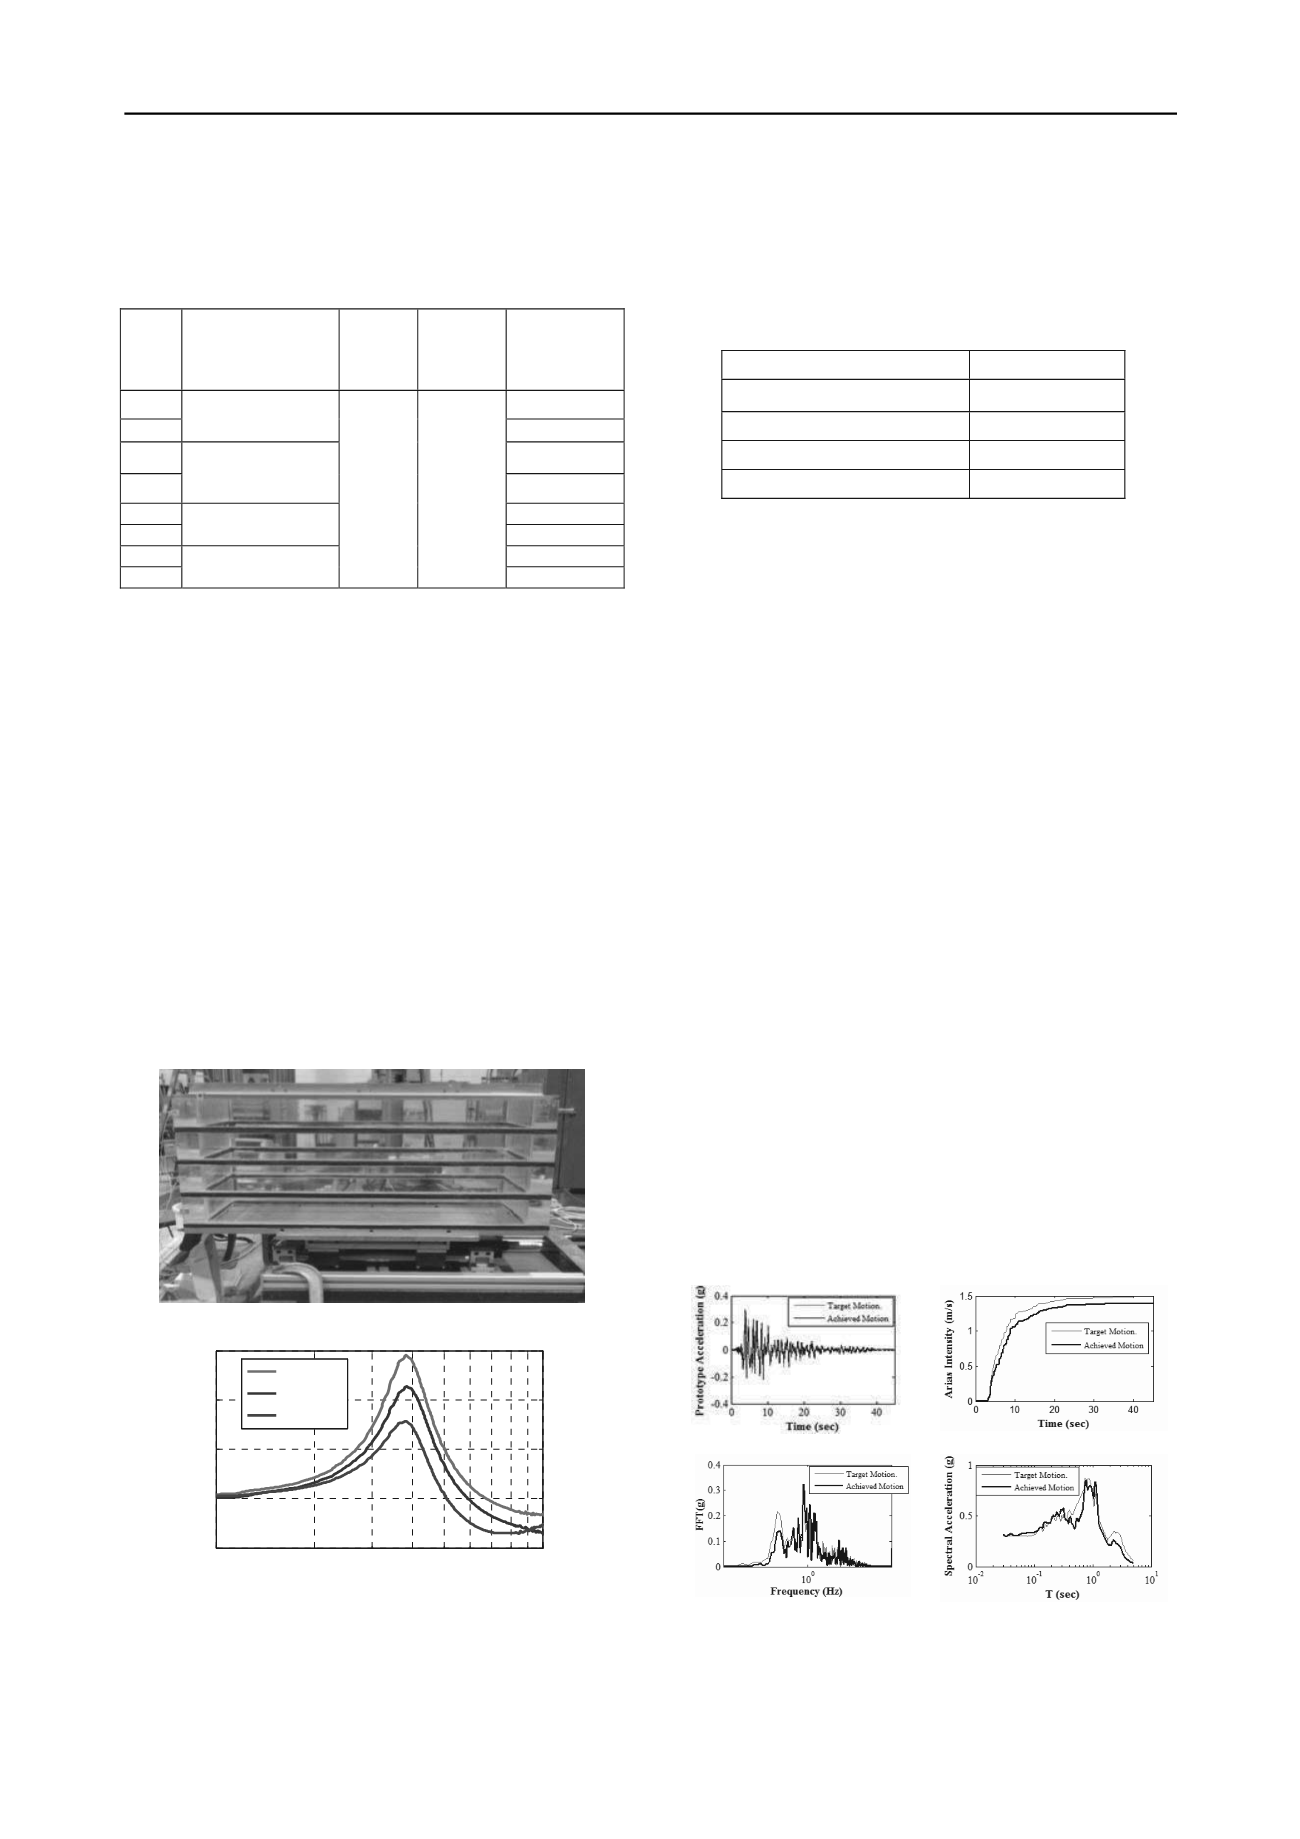
Figure 1. Picture of the transparent FSB container at CU Boulder
10
1
10
2
0
1
2
3
4
Frequency (Hz)
Transfer Function
Frame 4
Frame 3
Frame 2
Figure 2. Frequency response of the FSB container (different acrylic
frames with respect to the base) at 60g in model-scale.
2.2.2
Characterizing Soil Properties
Nevada Sand was chosen for use in the testing program, as it is
a well-characterized, uniform, fine, angular sand. A relative
density (D
r
) of 60% was selected for testing as it is expected to
show a slight dilative response during shaking which may
provide a worst-case scenario for seismic lateral earth pressures.
Table 2 summarizes the properties of Nevada Sand (Ghayoomi
et al. 2012a,b).
Table 2. Properties of Nevada Sand (Ghayoomi et al. 2012b)
Specific Gravity
2.65 (assumed)
Maximum Dry Unit Weight
16.39 kN/m
3
Minimum Void Ratio
0.586
Minimum Dry Unit Weight
14.00 kN/m
3
Maximum Void Ratio
0.852
2.2.3
Selection and Calibration of Ground Motions
A suite of earthquake ground motions was selected for design
based on the expected seismic hazard at the project site. The
selected records included scaled versions of the following
motions: 1) the Izmit Earthquake recorded at the Istanbul station
(far field); 2) the Northridge Earthquake recorded at the Sylmar
station (near field); 3) the Loma Prieta Earthquake recorded at
the LGPC station (near field). In addition to earthquake records,
sine-sweeps (with amplitude = 0.3g) were selected at
frequencies ranging from 0.5 Hz to 7 Hz in the prototype scale.
The goal was to evaluate the response of the soil-structure
system under a range of motions with different characteristics.
The “desired” ground motions were converted into “target”
ground motions that are safe to use in the centrifuge by filtering
out frequencies that are beyond the capability of the shake table
and are potentially damaging to the centrifuge (e.g., Mason et
al. 2010). In this case, frequencies less than 0.1 Hz and greater
than 15 Hz were filtered using an eighth-order band-pass
Butterworth filter. The target motions were converted to model
scale units for both time and acceleration values (e.g.,
accelerations multiplied by 60 and time values divided by 60),
to covert the “target” motion to the “command” signal.
The “achieved” motion by the shake table may not be the
same as the “command” motion because of the nonlinear
response of the overall system. The shake table tends to damp
out the higher frequency signals and amplify the lower
frequencies. A frequency-domain transfer function was applied
to the “command” signal iteratively in order to better match the
“achieved” motion with the “target”. Particular attention was
given to the Arias-Intensity time history of the “target” motion,
roughly quantifying the energy of the ground motion as well as
the 5%-damped spectral accelerations. Figure 3 compares an
example of “achieved” and “target” base motions during the
Northridge event with a scaled prototype PGA of 0.3g.
(a)
(b)
(c)
(d)
Figure 3. Comparison of the “achieved” and “target” motions during the
Northridge event (scaled PGA = 0.3g) in prototype scale.
2.2.4
Design of Equivalent Model Underground Structures
Three simple equivalent model underground structures were
designed and constructed (e.g., Figure 4), to simulate prototype


