901
Technical Committee 104 /
Comité technique 104
structures with a range of expected dynamic properties (e.g.,
mass and stiffness). The first mode frequency of each structural
model was measured in a 1-g shaking table test as shown in
Figure 5a. The frequency values were in good agreement with
the numerical estimates obtained using SAP and Abaqus. The
quality of the weld between the walls of models was observed
to be a key parameter in obtaining a good match between
numerical and experimental values of the resonant frequencies.
(a)
(b)
(c)
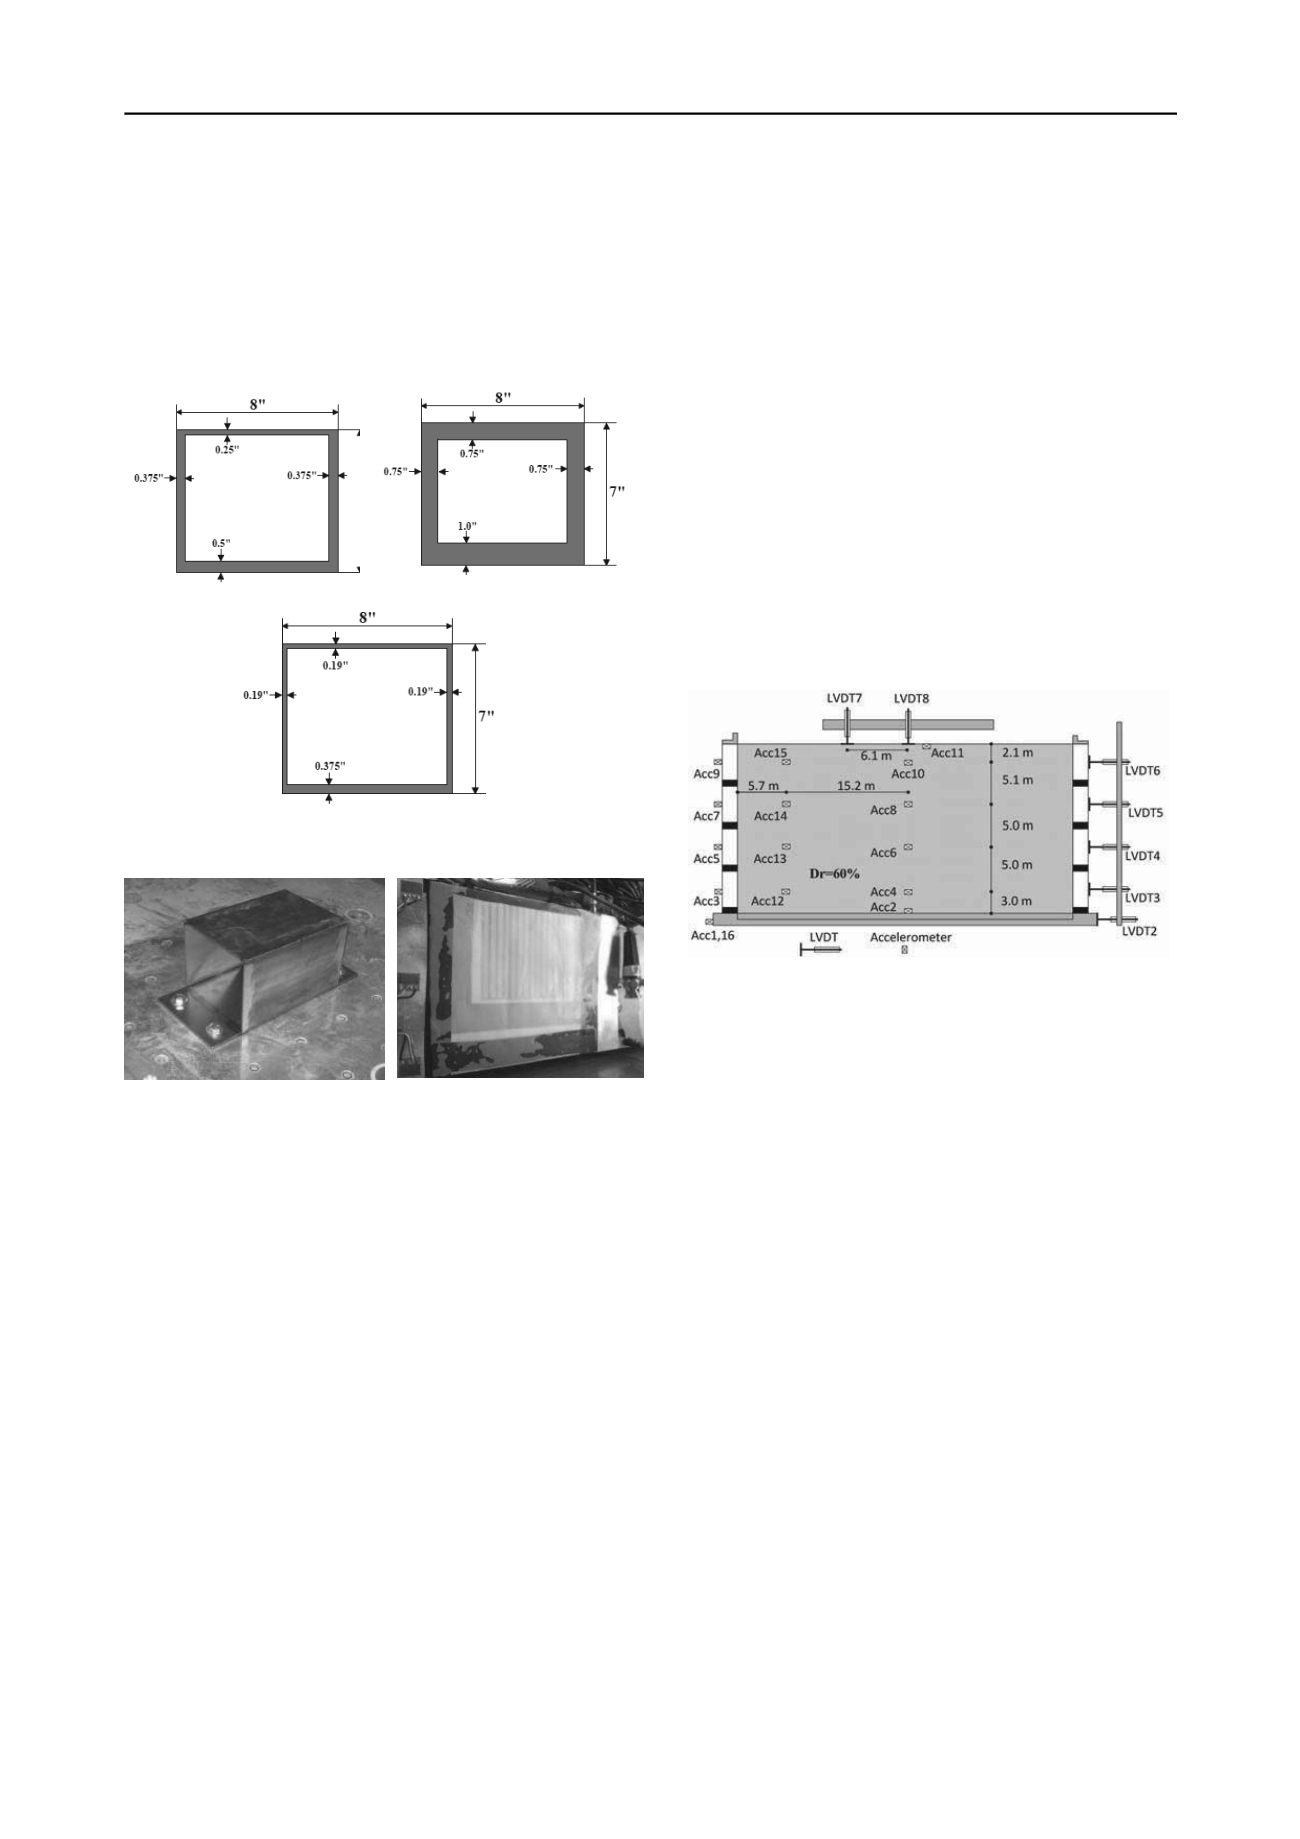
Figure 4. Dimensions of three model structures in model scale: (a) SEP
Structure; (b) Stiff SEP; (c) Flexible SEP.
(a)
(b)
Figure 5. Baseline structure: a) 1-g shake table testing; b) Tekscan
pressure sensor placement on the tunnel wall.
2.2.5
Instrumentation Challenges
Horizontal LVDTs were mounted on a rack attached to the
stationary centrifuge platform and the light-weight cores were
attached to the container frames. Vertical LVDTs were attached
to a rack mounted on the top of the container. Permanent
racking displacement of the tunnel structures was assumed to be
small due to the high stiffness of these models. Hence,
accelerometers were judged to provide a reasonable means for
estimating transient racking deformations for each underground
structure. Visual monitoring of the structures through the
transparent walls of the container provides another means for
the verification of racking behavior during shaking.
Tactile pressure sensors from Tekscan, Inc. were used in
this study to measure dynamic earth pressures. They are
flexible, thin sheets capable of measuring normal stresses
applied with a matrix of sensels. This flexible sensor permits
measurement of 2–D stress distributions on a surface with
minimum deflection. Previous commercially-available tactile
sensors were not reliable in capturing the full amplitude content
of dynamic signals under the high-frequency environment of the
centrifuge. This is in part due to signal aliasing and the sensor’s
own frequency response (filtering effect). The sensor model
used in this study (9500) has a sampling rate up to 4,000 Hz,
which is rapid enough to avoid signal aliasing. The frequency
response of each sensors was then characterized in dynamic
tests using a load frame (Dashti et al. 2012). The frequency
recover the original pressure time histories. The response and
accuracy of these tactile pressure sensors are affected by the
presence of shear (Palmer et al. 2009). Shear was minimized by
incorporating a Teflon-Teflon interface between the sensor and
soil (Figure 5b) as recommended by Palmer et al. (2009)
response of these sensors was used as a transfer function to
PRELIMINARY FREE-FIELD TEST
e) was prepared and
3.1
Test Setup and Instrumentation
ive density of 60% was
3
A free-field soil model (with no structur
tested at 60g of spin acceleration, as the baseline experiment to
investigate the dynamic response of dry Nevada Sand and the
performance of the container when filled with sand.
A layer of Nevada sand with a relat
prepared by dry pluviation in the FSB container. The sand was
placed atop a 5 mm-thick layer of gravel, which is intended to
provide a no-slip boundary at the base of the soil profile. The
dimensions of the sand specimen were: 700 mm long, 305 mm
wide, and 336 mm high in the model scale. The instrumentation
layout within the sand layer, including LVDTs and
accelerometers, is shown in Figure 6.
Figure 6: Instrumentation layout in preliminary free-field test
3.2
Test Results
n example array of acceleration recordings
4
4.1
Test Setup and Instrumentation
EP model structure was
4.2
Test Results
Table 3 summarizes the sequence and PGA’s of the achieved
base motions during Test 1. Figure 9 compares the acceleration
(dimensions in prototype scale).
Figure 7 presents a
within the soil column and a comparison of Arias Intensity-time
histories recorded by the accelerometers in the center of the soil
profile and near the boundary of the container. The comparisons
show little difference between the two arrays, indicating
minimum boundary effects in this container. The recorded
settlement time histories at two locations were also consistent.
The settlement measurements indicated little densification
during the application of sine-sweeps, and considerable
densification during each broad-band earthquake motion.
Hence, the change in soil relative densities after each event
must be incorporated into the numerical models.
CENTRIFUGE TESTING OF SOIL-STRUCTURE
SYSTEM
A preliminary test on a trial flexible S
performed to evaluate the proposed model instrumentation and
response. The model was instrumented with accelerometers,
LVDTs, strain gauges, and pressure transducers as shown in
Figure 8. Accelerometers were placed away from, adjacent to,
and on the structure to evaluate soil-structure-interaction effects.
LVDTs were used to measure settlements at key locations.
Strain gauges were placed on both walls to measure moment
distributions and to indirectly calculate dynamic earth pressures.


