2132
Proceedings of the 18
th
International Conference on Soil Mechanics and Geotechnical Engineering, Paris 2013
was hinged at the bottom of the test box so as to allow lateral
displacement to occur during the wetting and drying process.
The backfill soil was a non-plastic poorly-graded sand,
commonly known as decomposed granite soils (DCG) in Korea,
classified as SP as per ASTM 2487 (ASTM 1992) with the
effective size (
D
10
), uniformity coefficient (
u
), and coefficient
of curvature (
c
) of 0.36 mm, 5.3 and 1.1, respectively. The
soil was compacted to 70% of its maximum unit weight
(
) to create reinforced as well as retained zones. The
estimated effective internal friction angle (
C
'
C
3
/
19
m kN
) using a series of
consolidated-undrained (CU) triaxial compression tests with
pore pressure measurements at a density corresponding to the
as-compacted state was determined as approximately 35
with a
shear stress intercept of 8 kPa.
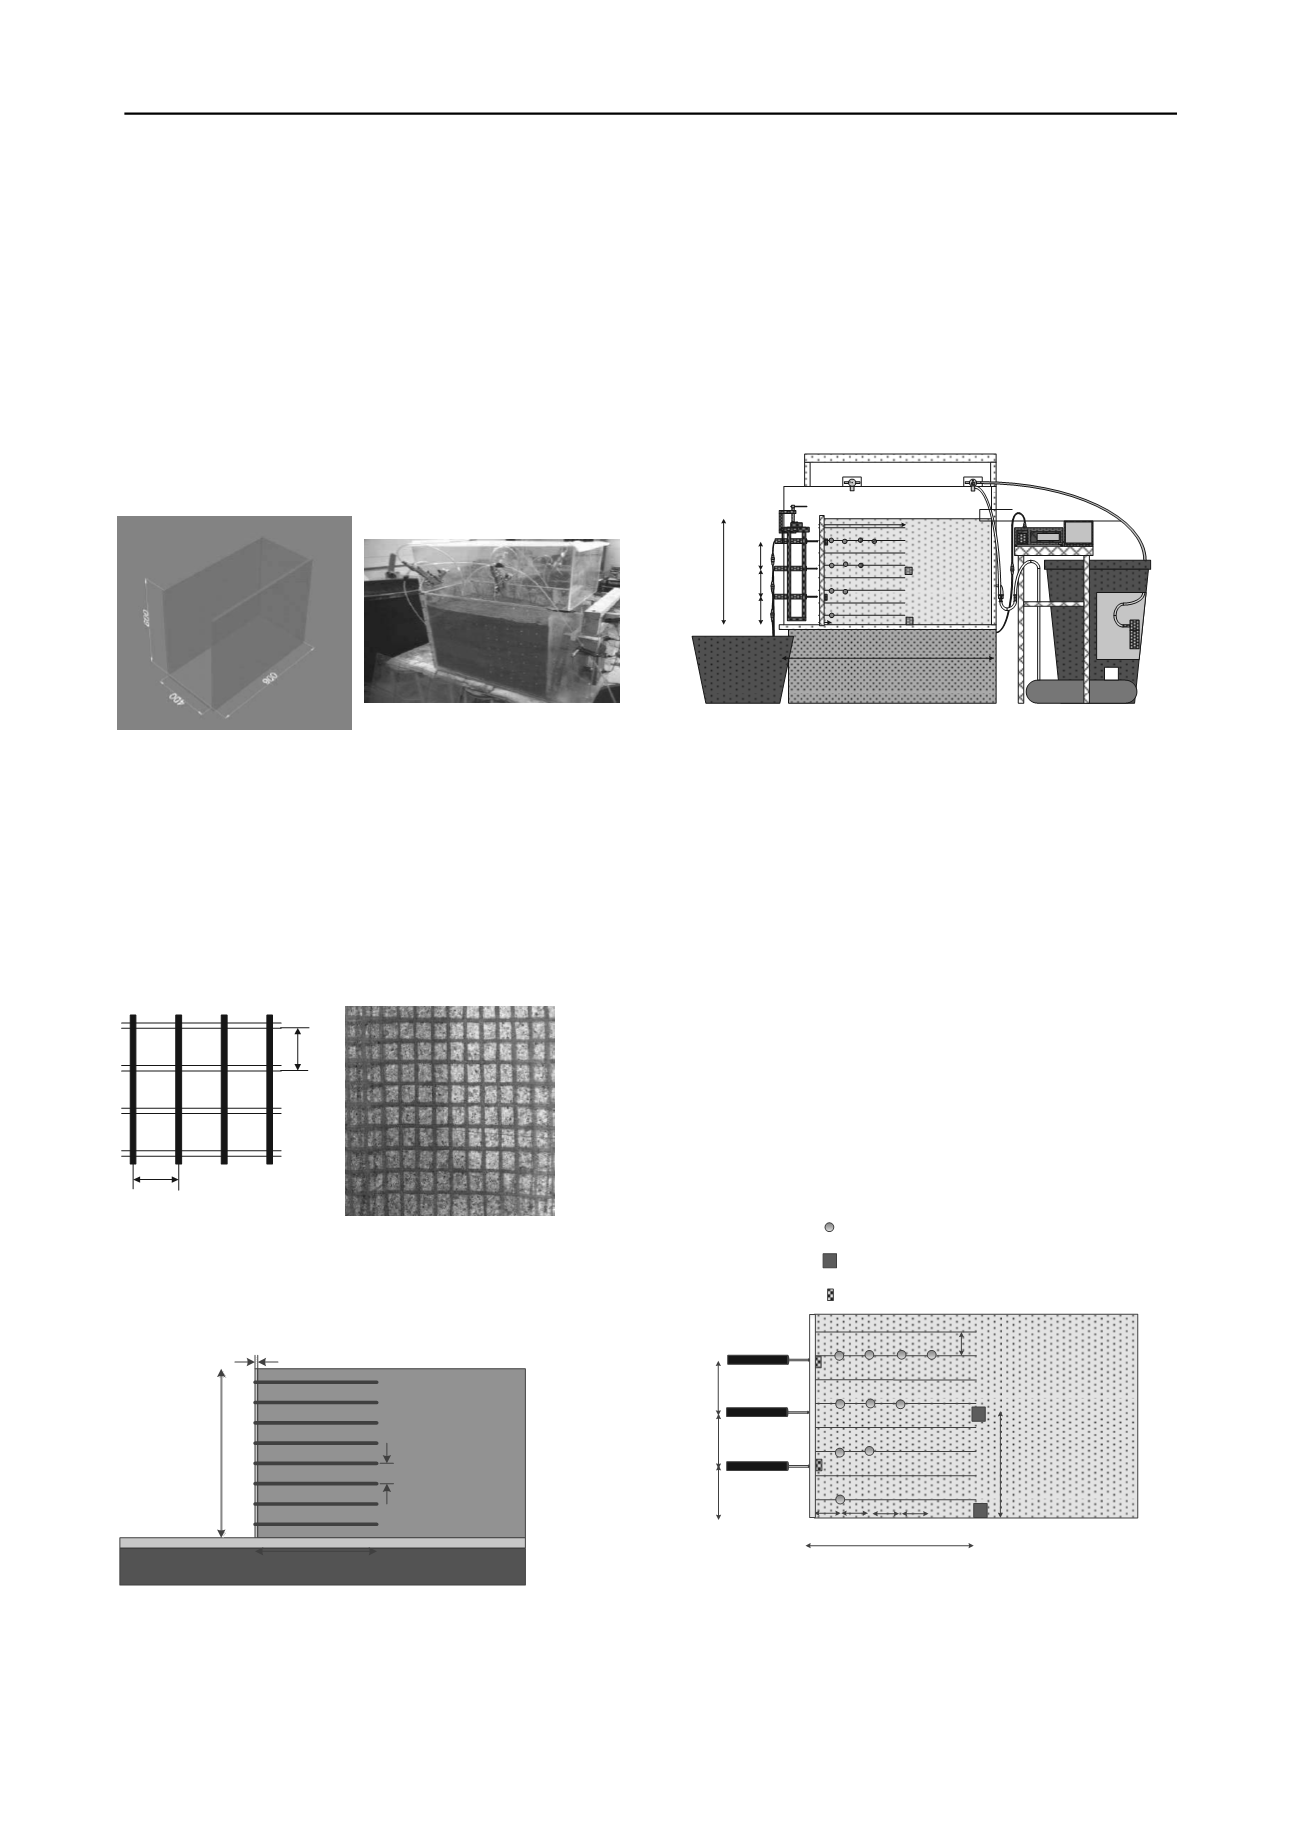
(a) Test box (unit mm)
(b) photo of model GRSW
Figure 1. Test box and model GRSW
A non-woven geotextile was used as reinforcement. Note
however that the tensile strength of the non-woven geotextile
was intentionally reduced by creating 5 mm x 5 mm square
holes (Figure 2) to have an ultimate tensile strength of
. Six layers of reinforcement, 35 cm in length
each, were placed at a vertical spacing of 6 cm (Figure 3). The
reinforcement layers were firmly connected to the wall facing
by bolting.
m kN
/
10 8.3
2
(a) square hole size
(b) photo of model reinforcement
Figure 2. Model geotextile reinforcement
Figure 3. Schematic sectional view of model GRSW
2.2 Rainfall simulation
Three cycles of wetting and drying were applied to the model
walls to simulate the natural weather condition. Two rainfall
intensities ( ) were considered, i.e., 18.7 mm/h and 56.2 mm/h
for a given total precipitation of 450 mm. The duration of the
rainfall for the case with
was therefore 24 hours
while 8 hour duration was used for the case with
.
Note that these rainfall conditions were based on the actual
rainfall occurred in 2011 in Kyoung-Gi province, Korea.
Followed after each wetting process was a 24 hour drying
period prior to the ensuing wetting to observe the wall behavior
during the repeated wetting and drying.
r
I
h mm
I
r
/
7.18
2.56
h mm
I
r
/
2.56
The rainfall was simulated by spraying water at the top of
the backfill using spray guns with 15HP compressor and a 20W
water motor (Figure 4).
Data
Logger
Note
book
900
50
350
500
125
125
125
Unit: mm
Figure 4. Schematic diagram of rainfall simulator
2.3 Instrumentation
The performance of the model GRSW under a series of wetting
and drying cycles was evaluated in terms of wall facing
displacements, pore water pressures, and reinforcement strains.
The layout of instrumentation program is shown in Figure 5.
As shown, the horizontal displacements of the wall facing
were measured by using three LVDTs having gauge length of
100 mm, placed at locations along a vertical row. In addition,
the wetting and drying cycle induced reinforcement strains were
measured using high-elongation strain gauges, manufactured by
Tokyo Sokki Kenyujo Company (Model YFLA-5-5L) which
were mounted directly onto the selected reinforcement layers in
one array. Also installed at the back of the reinforced zone
were two pore pressure cells (Model BPR-A-200 kPa) at the
bottom (0 mm) and 250 mm above the wall base. The
volumetric water content of the backfill soil during the wetting
and the drying process was also measured using a tensiometer
(Model EC-5).
Unit [mm]
5
5
Figure 5. Instrumentation layout
3 RESULTS AND DISCUSSION
3.1 General behavior
Figure 6 show the measured data for the rainfall intensity of
. As mentioned, the
intensity rainfall
h mm
I
r
/
2.56
h mm
/
500
5
350
60
Unit : mm


