2128
Proceedings of the 18
th
International Conference on Soil Mechanics and Geotechnical Engineering, Paris 2013
al. (2002), Lee and Nam (2006), Bobet and Nam (2007) and
Arjnoi et al. (2009)).
The corresponding reductions in axial forces and stresses on
segmented tunnel linings in comparison with fully waterproofed
linings are significant, although inconsistent. For example
Arjnoi et al (2009) observed a 20% reduction, Lee and Nam
(2001) 25%, Potts et al. (2002) up to 30% and Lee and Nam
(2006) up to a 70% reduction.
1.1.1
Surface settlement
Notwithstanding the potential advantages of allowing through-
structure seepage, some detrimental effects have been noted in
the analyses of shallow tunnels which might be relevant to
through-wall seepage. Significant settlements have been
observed associated with segmented lined tunnels acting as
drains in fine grained soils. For example, Yoo (2005) noted that
settlement was proportional to the amount of drawdown in the
groundwater levels around the tunnel. Consolidation settlement,
ρ
due to the drawdown of groundwater level may be estimated
in a similar manner by considering the one dimensional stiffness
modulus, E
’
0
of the soil as shown in equations 1 and 2 (Roberts
et al. 2007).
v
E
'
0
400 '
(1)
av
avw
E
SD
0
'
(2)
where
σ
’
v
, D, �
w
and S
av
are the vertical effective stress,
thickness of the soil layer, unit weight of water and average
drawdown respectively.
In this paper, pore water pressure variations around
contiguous pile retaining walls are investigated numerically.
An expression for the resulting effective bulk wall permeability
k
p
, is derived. This is then applied to two dimensional analyses
of contiguous and secant pile retaining walls to highlight the
advantages of a semi-permeable structure.
2 NUMERICAL ANALYSES
Numerical simulations were conducted using the finite
difference geotechnical application FLAC2D (ITASCA, 2012).
The investigations were undertaken in two phases. Horizontal
flow was simulated in phase 1 to determine how pore pressures
and steady state flow vary with x/d in order to derive an
expression for k
p/
k
s
. This relationship was then applied to a
vertical plane flow in phase 2 and the pore pressures calculated.
Preliminary analysis, not included in this report, were carried
out to establish i) suitable boundary locations, ii) the size of the
numerical grid and iii) the limiting value of x/d. Grid
boundaries were selected such that x/d did not influence the far-
field conditions. It was determined that increasing x/d above 2
did not significantly impact the results.
2.1
Model soil and wall properties
An elastic constitutive soil model was used in all analyses.
Elastic properties of bulk and shear moduli were used instead of
Young’s modulus and Poisson’s ratios. The soil and model pile
section and the model wall in phases 1 and 2 respectively were
represented by grid elements attached directly to the soil grid
without the use of interface elements so as to allow cross-
boundary flow. Uncoupled groundwater flow analyses which
ignored the impact of mechanically induced pore pressures were
performed.
2.2
Derivation of bulk wall permeability, k
p
The simulations started with a ‘wished into place’ model pile
section and the water level at the surface. Pore pressures at the
discharge surface shown in figure 1 were lowered incrementally
corresponding to pressure drops U
i
for each step. Steady state
discharge and pore pressures were measured and fluid flow-
paths tracked for different pile gap to diameter ratios x/d.
Figure 1. Plan of typical numerical grid showing boundary conditions
for phase 1 analyses.
2.2.1
Results and discussion
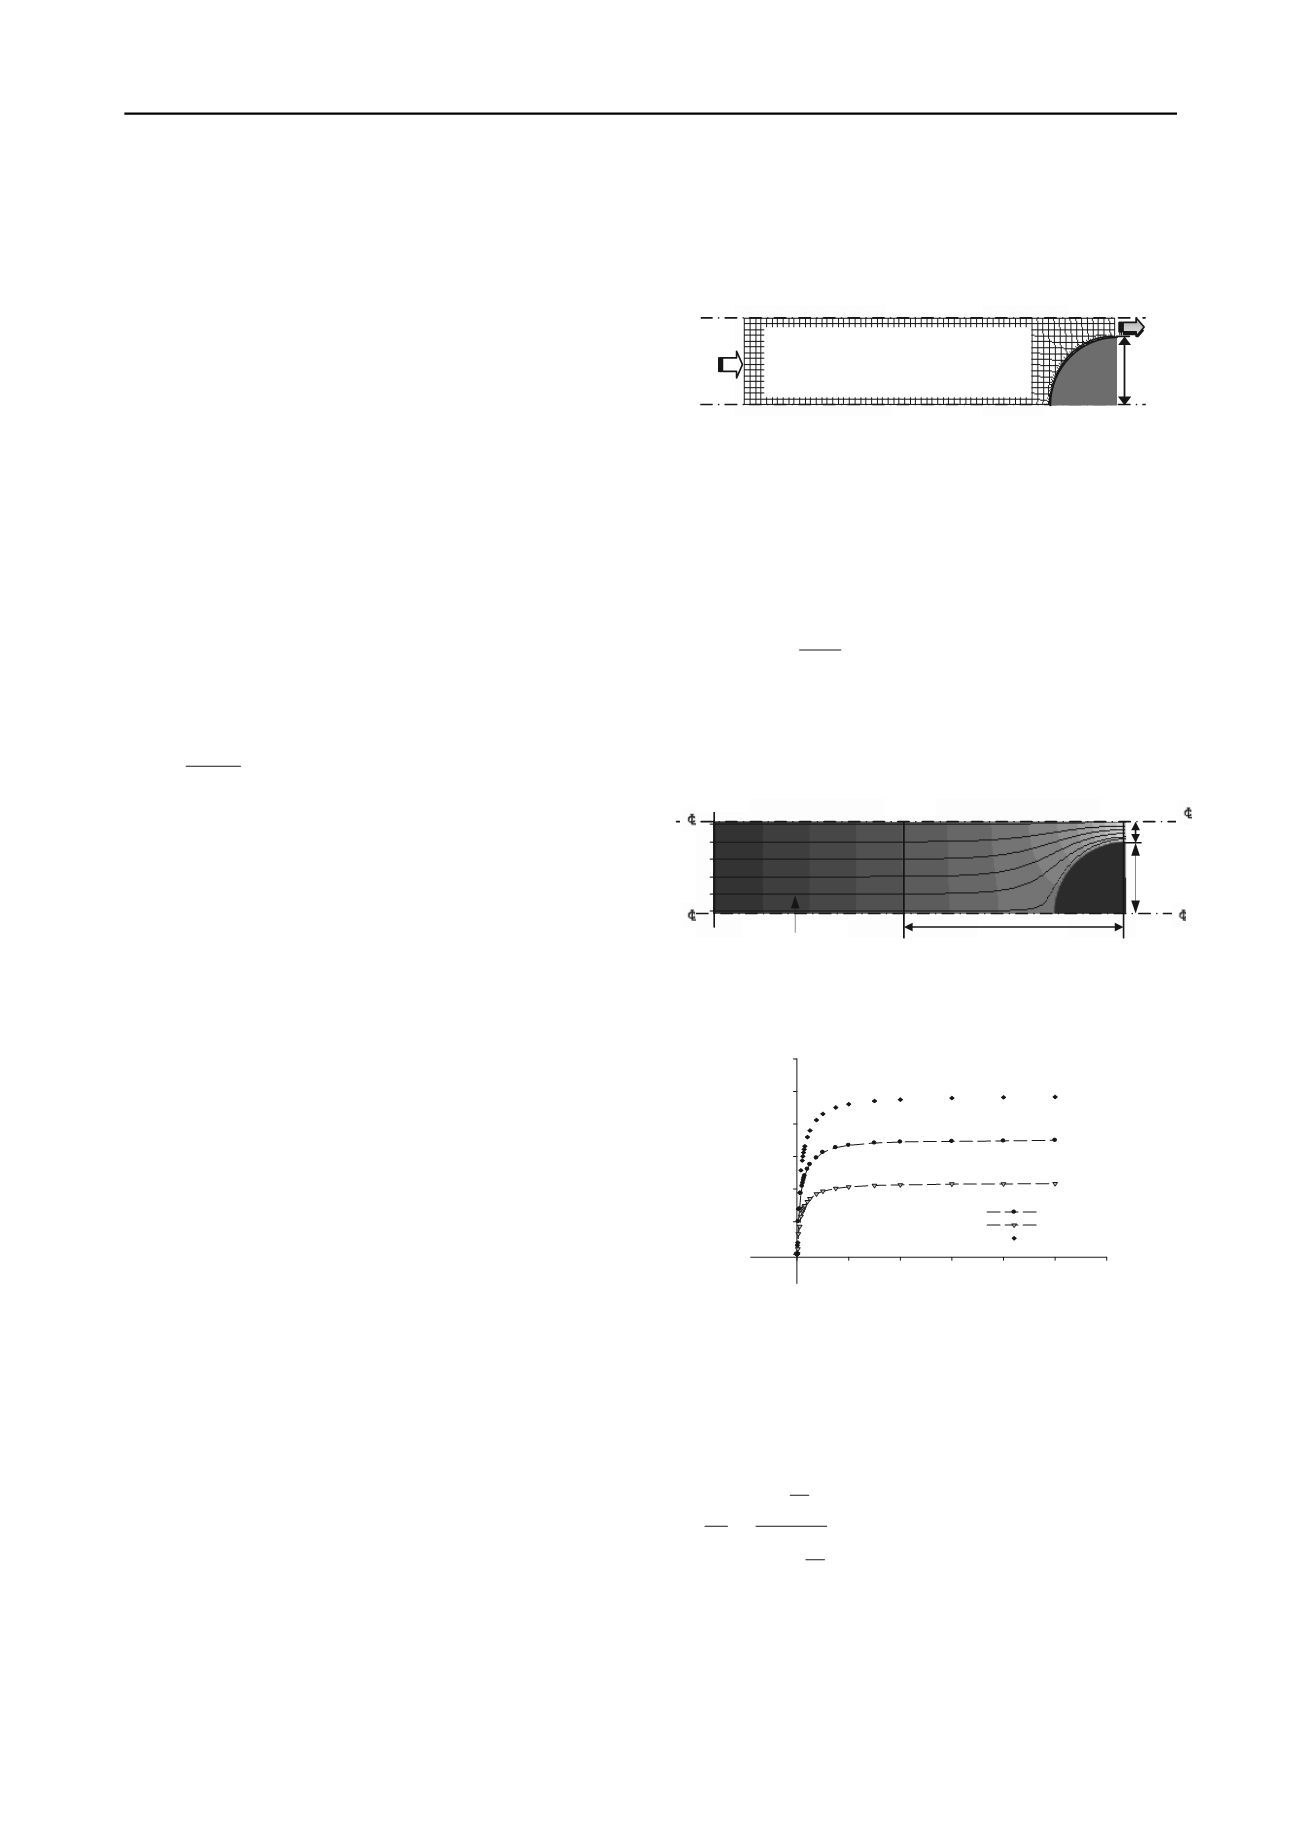
Darcy’s equation for steady state flow (Eq. 3) was applied using
the parameters
∆
l, h
1
, and h
2
indicated in figure 2 and the values
compared with the numerically derived flow rates (Q
i
) in figure
3 at pressure differences, U
i
.
l
h hpp
kAQ
2 1
(3)
where (h
1
-h
2
)/
∆
l is the hydraulic gradient between the distance
of influence and the discharge surface (see Figure 2). (The
distance of influence was selected as the point beyond which the
hydraulic gradient was uniform).
Figure 2. Calculating bulk wall permeability, k
p
and flow-paths.
Pile gap to diameter ratio, x/d
0
2
4
6
8
10
12
Flowrates,Qm
3
/s
0.0
5.0e-7
1.0e-6
1.5e-6
2.0e-6
2.5e-6
3.0e-6
Q2
Q3
Q1
Figure 3. Steady state flow-rates, Q
i
at various pressure drops U
i
.
The resulting bulk wall permeability was calculated for a soil
permeability k
s
=2x10
-5
m/s and plotted for three values of U
i
(see Figure 4). The empirical hyperbolic relationship between
the pile gap to diameter ratios x/d and permeability ratios k
p
/k
s
derived in the phase 1 simulation is given in equation 4.
d
x
d
x
s
p
41
4
k
k
(4)
Soil: Density ρ =1600 kg/m3
Bulk modulus K=417 MPa
Shear modulus G =192 MPa
Discharge
No flow
No flow
N
flow
o
Model pile
Recharge
℄
℄
℄
℄
h
0
h
1
h
2
x/2
d/2
∆l
Flow line


