2129
Technical Committee 207 /
Comité technique 207
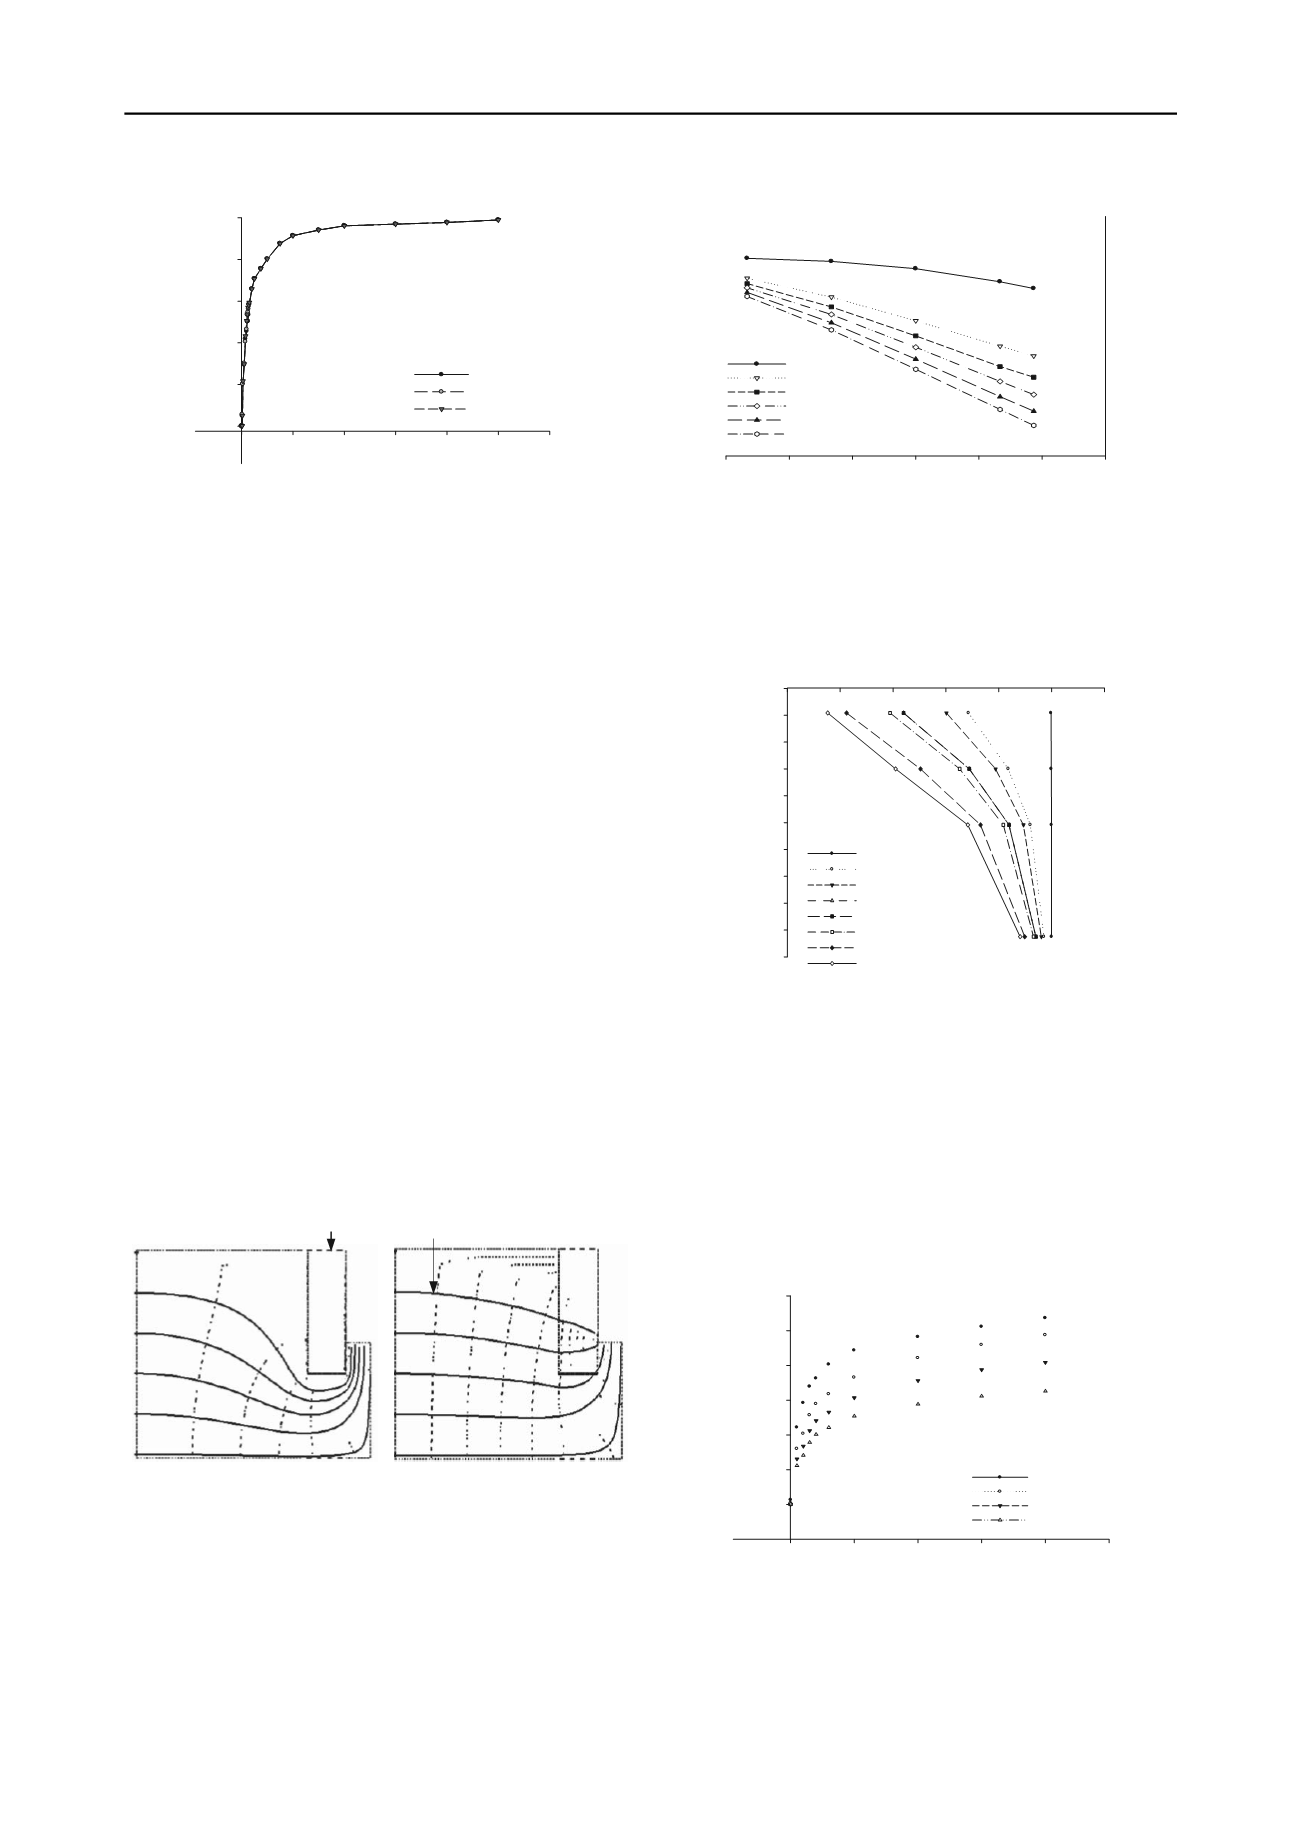
x/d
0
2
4
6
8
10
12
k
p
/k
s
0.0
0.2
0.4
0.6
0.8
1.0
U1 =5.4kPa
U2 =3.9kPa
U3 =2.4kPa
Figure 4. Calculated permeability from FLAC2D simulations.
2.3
Application of derived expression to 2D analyses
The aim of phase 2 simulations was to test the application of the
permeability expression derived in phase 1.
2.3.1
Procedure
A continuous wall was used to represent the contiguous pile
retaining wall. The model wall thickness (t) was calculated by
equating the second moments of area (I) of the different cross-
sections (A) as outlined by Powrie et al (1999) (Eq. 5). This
gave a result similar to the stiffness approach adopted by Day
and Potts (1993) (see Eq. 6 and 7).
m
I
p
I
(5)
EA tE
eq
(6)
EI
E
eq
(7)
where E
eq
and E are the equivalent model wall stiffness and
material Young’s modulus respectively.
The simulations commenced as before with a ‘wished into
place’ model wall. Pore pressures were varied corresponding to
U
i
as before for different pile gap to diameter ratios, x/d.
2.3.2
Results and discussion
It was observed that flow patterns for the ‘permeable’ walls
deviated from the classically accepted flow around an
impermeable retaining wall especially at higher values of x/d.
This seems to suggest that through-wall flow is taking place for
x/d>0.0 as shown in figure 5.
Figure 5. Tracked flow-paths for x/d=0 and x/d=0.1. Note these are not
intended to be flownets, hence the flow elements are not “square”.
2.3.3
Pore pressure distribution
Pore pressures ratios P
i
/P
0
are plotted against normalized
distance (L/d) from the model wall in figure 6 for various values
of x/d.
Distance behind wall/pile diameter (l/d)
-3.5
-3.0
-2.5
-2.0
-1.5
-1.0
-0.5
Normalizedporepressure(P
1
/P
0
)
0.0
0.2
0.4
0.6
0.8
1.0
1.2
x/d=0.05
x/d=0.15
x/d=0.3
x/d=0.5
x/d=1.0
x/d=2.0
Figure 6. Normalised pore pressures for different x/d against distance
(L/d) from the wall.
It was observed that pore pressures at each position behind
the wall decreased with x/d as the equivalent permeability
increased. Further analyses have shown that the pore pressures
and hence hydraulic head reduce towards the wall (Figure 7).
Normalised pore pressure (P
i
/P
0
)
0.0
0.2
0.4
0.6
0.8
1.0
1.2
Depth/pile length (Z/L
p
)
-2.4
-2.2
-2.0
-1.8
-1.6
-1.4
-1.2
-1.0
-0.8
-0.6
-0.4
x/d=0.001
x/d=0.05
x/d=0.1
x/d=0.2
x/d=0.2
x/d=0.3
x/d=1.0
x/d=2.0
Figure 7. Normalised pore pressure versus normalized depth below soil
surface for different values of x/d.
2.3.4
The effect of seepage on surface settlement
Surface settlements increased as the bulk permeability of the
wall increased (see Figure 8). The calculated settlement values
were compared with an estimated solution which uses the one
dimensional stiffness modulus (Roberts et al 2007). It was
noted that the 1D stiffness modulus method over-predicted
surface settlement at higher x/d as shown in Figure 9. This is
unsurprising as in this approach all volume change is assumed
to manifest as vertical settlement.
Pile gap to diameter ratio, x/d
0.0
0.5
1.0
1.5
2.0
2.5
Normalized settlement (S/S
0
)
0.8
1.0
1.2
1.4
1.6
1.8
2.0
2.2
0.67d behind
1.13d "
1.80d "
2.47d "
Figure 8. Normalised settlement increases with soil/structure
permeability.
Flow line
Wall
a)
b)


