1465
Technical Committee 203 /
Comité technique 203
factor (B
r
) as (B
t
/B
p
), where the breakage potential (B
p
) is the
area between the original grain-size distribution curve and the
No. 200 sieve size; and the total breakage (B
t
) is the area
between the original grain-size distribution curve and the final
grain-size distribution curve. For the North Coast calcareous
sand tested under cyclic loading at σ′
c
ranging from 50 to 200
kPa, the calculated values of B
r
ranged from 0.01 (1.09%) to
0.02 (2.23%), which are considered low breakage factors. It was
concluded that crushing during testing this sand under cyclic
loading was insignificant for the range of σ′
c
applied herein.
3.1
Effect of cyclic stress ratio (CSR)
The effect of CSR on liquefaction susceptibility was
investigated by plotting the number of cycles required to cause
liquefaction (r
u
= 1.0) versus CSR for samples tested at various
σ′
c
for D
r
of 40% as shown in Figure (4). Results indicated that
at the same σ′
c
, the number of stress cycles required to reach
liquefaction (r
u
= 1.0) decreases as CSR increases.
0.00
0.05
0.10
0.15
0.20
0.25
0.30
0.35
0.40
0
100
200
300
400
500
600
Number of Cycles to reach ru = 1.0
Cyclic Stress Ratio, CSR
σc ' = 50 kP a
σc ' = 100 kP a
σc ' = 200 kP a
Figure 4. Number of cycles to liquefaction (r
u
= 1.0) versus CSR at
various σ′
c
for North Coast calcareous sand (D
r
= 40%)
The effect of CSR on the cyclic resistance of North Coast
calcareous sand is in agreement with that attained in previous
researches on clean siliceous sands (Seed and Lee, 1966; and
Hussein, 2008). Similar agreement in behavior was observed
with other calcareous sands reported in literature (Hyodo et al.,
1998; Sharma and Ismail, 2006; and LaVielle, 2008).
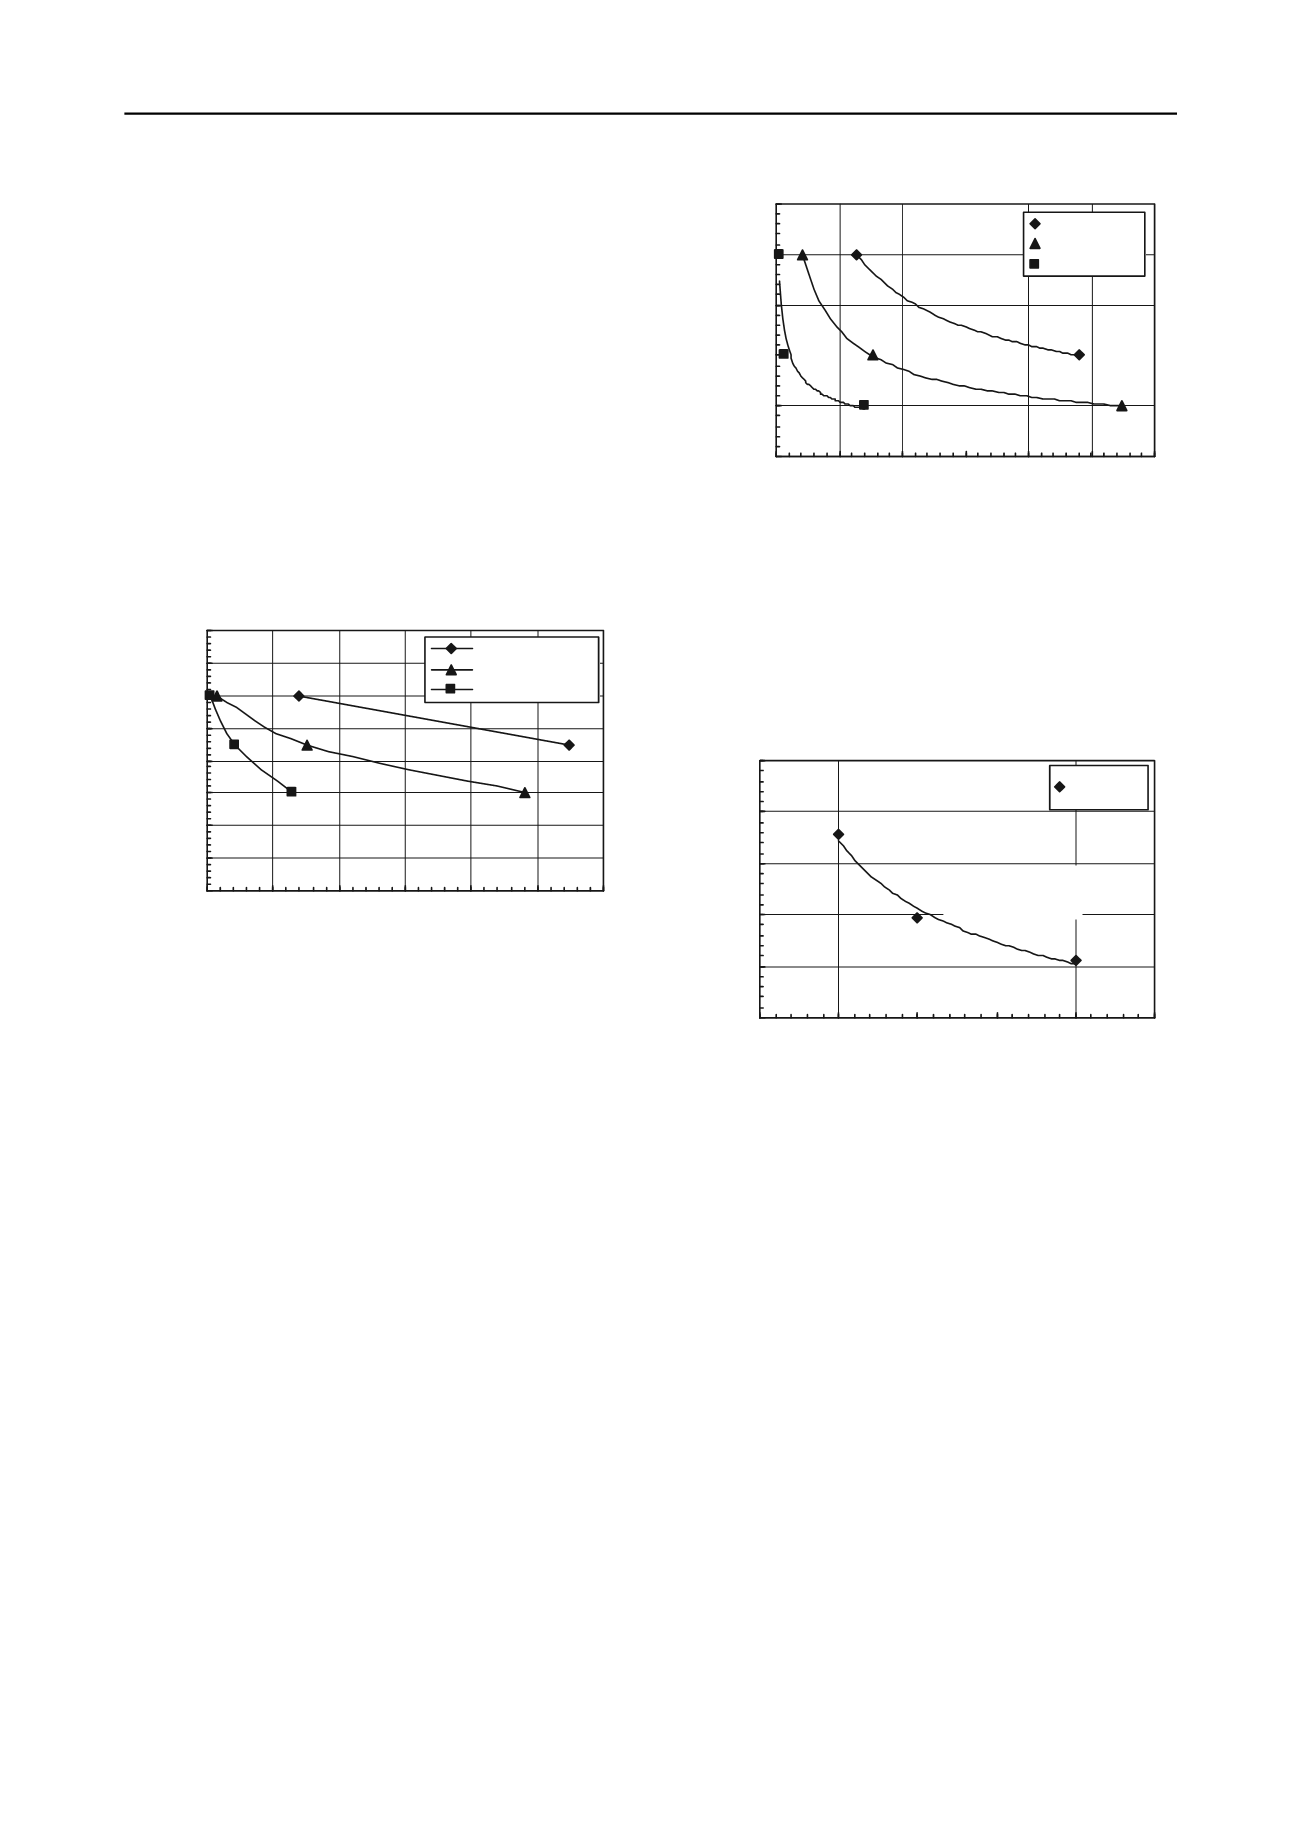
3.2
Effect of effective confining pressure (σ′
c
)
The effect of σ′
c
on liquefaction susceptibility of the tested sand
is illustrated in Figure (5). Number of cycles required to cause
liquefaction is plotted versus σ′
c
, at various values of CSR. For
the same CSR, the number of cycles required to cause
liquefaction increased as σ′
c
decreased.
Various opinions have been reported in the literature
regarding the effect of σ′
c
on liquefaction susceptibility for
calcareous and siliceous sands. Stedman (1997) observed that in
cyclic loading of siliceous sands, increasing the σ′
c
generally
decreased the resistance to liquefaction (similar to North Coast
calcareous sand); however, in the loosest states the increase in
confining stress had little effect on resistance to liquefaction.
For Dogs Bay carbonate sands, Hyodo et al. (1998) noticed that
the cyclic strength increased as σ′
c
decreased, which is similar
to the behavior of North Coast calcareous sand. Moreover, Finn
et al. (1971) mentioned that at a certain void ratio, the CSR and
number of stress cycles to reach liquefaction in siliceous sands
are uniquely related, independent of the consolidation stress.
However, the behavior of North Coast calcareous sand
contradicts with what has been reported by Seed and Lee (1966)
and Peacock and Seed (1968) for clean siliceous sand, as they
found that as σ′
c
increased, the number of cycles to failure
increased.
0
50
100
150
200
250
0
100
200
300
400
500
600
Number of Cycles to reach ru =1.0
Effective Confining
Pressure (kPa)
C S R : 0 . 15
C S R : 0 . 2 2 5
C S R : 0 . 3 0
Figure 5. Number of cycles to liquefaction (r
u
=1.0) versus σ′
c
at various
CSR for North Coast calcareous sand (D
r
= 40%)
3.3
Correlation between CRR and other factors
In this study, the Cyclic Resistance Ratio (CRR) is defined as
the CSR required to cause liquefaction in 20 loading cycles to
represent an earthquake of magnitude 7.5 (Ishihara, 1993). For
tested specimens, the value of CRR at each σ′
c
was determined.
Variation of CRR with σ′
c
is shown in Figure (6).
y = 1.1179x
-0.2811
R
2
= 0.9815
0.20
0.25
0.30
0.35
0.40
0.45
0
50
100
150
200
250
Effective Confining Pressure (kPa)
Cyclic Resistance Ratio, CRR
D r = 4 0 %
Figure 6. Variation of CRR with σ′
c
for North Coast calcareous sand
4 COMPARISON WITH SANDS IN LITERATURE
4.1
Comparison with siliceous sands
The obtained test results were compared to other results
reported in the literature for the more commonly studied
siliceous sands. Generally, the cyclic behavior of the North
Coast calcareous sand followed the behavior adopted by
siliceous sands. Under the same σ′
c
and initial D
r
, the number of
cycles required to reach liquefaction (r
u
= 1.0) increased as the
value of CSR decreased as shown in Figure (7).
It was initially thought that the more compressible soil
skeleton of calcareous sand would result in a more contractive
soil matrix and thus result in calcareous sands being more
susceptible to liquefaction than siliceous sands. This research
and others have found that this is not true. The results shown in
Figure (7) indicate that North Coast calcareous sand has greater
cyclic strength and is less susceptible to liquefaction compared
to siliceous sands at the same D
r
. Increased cyclic strength is
likely to be the result of the angular calcareous sand particle
shape, which provides more stable interlocking soil fabric
resistant to liquefaction (Kaggwa and Poulos, 1990; Hyodo et
al., 1996; Hyodo et al., 1998; Morioka and Nicholson, 2000;
Sharma and Ismail, 2006; and LaVielle, 2008).


