1464
Proceedings of the 18
th
International Conference on Soil Mechanics and Geotechnical Engineering, Paris 2013
mostly ranging from 0.2 to 2 mm with fines content of about
8.75%. The soil is classified as poorly graded sand (SP)
according to the USCS (ASTM D2487) and is classified as
calcite-sand according to Hallsworth and Knox (1999). The
grain-size distribution curve of the tested sand is shown in
Figure (1). Maximum and minimum void ratios of the tested
sand (ASTM D4253 and D4254, respectively) equaled 1.043
and 0.753, respectively; and the specific gravity (ASTM D854)
equaled 2.79.
0
10
20
30
40
50
60
70
80
90
100
0.01
0.1
1
10
Grain Size (mm)
Percent Finer (%)
Figure 1. Grain-size distribution curve of North Coast calcareous sand
An electro-pneumatic Cyclic Triaxial apparatus was used to
study the liquefaction susceptibility of the tested sand (ASTM
D5311). Two isotropically consolidation tests were conducted
on two samples prepared at initial relative densities (D
r
) of 20%
and 75% in the triaxial apparatus to determine the change in the
initial D
r
under the application of different σ′
c
. The relationship
between D
r
and σ′
c
is presented in Figure (2). Using Figure (2)
and knowing the test σ′
c
and target D
r
at end of consolidation
stage, the initial D
r
at sample preparation was determined.
Samples were prepared by tamping using undercompaction
technique (Ladd, 1978).
0.0
0.1
0.2
0.3
0.4
0.5
0.6
0.7
0.8
0.9
1.0
0 50 100 150 200 250 300 350 400 450
Effective Cell Pressure (kPa)
Relative Density, D r
Initial Dr = 75%
Initial Dr = 20%
Figure 2. Target relative density contour lines
Typically, sands have high permeability, thus the saturation
phase should take place quickly. However, it has been the
author’s experience that the saturation of calcareous sand was
not as easy as the saturation of quartzitic sands, most likely due
to the large intra-particle void structure in this type of sand.
Thus, flushing the air outside the sample and sample saturation
were considered two critical steps prior to cyclic testing. The
adopted testing approach used a stair-step procedure for
saturation, where the confining cell pressure and back pressure
were increased simultaneously every approximately 40 minutes
by 50 kPa. Then the sample was left overnight under a back
pressure of about 280 kPa. A minimum back pressure of 400
kPa was applied to most samples by the end of the saturation
process. Skempton’s (1954) pore-pressure parameter ''B'' of
0.98 was achieved for all test samples. Similar observations for
saturation of calcroues sand were reported by LaVielle (2008).
3 CYCLIC TRIAXIAL TESTING
Stress-controlled isotropically consolidated undrained cyclic
triaxial tests were conducted on the North Coast calcareous sand
to study the liquefaction susceptibility under different σ′
c
and
Cyclic Stress Ratios (CSR). Each specimen was prepared at a
specific initial D
r
in order to reach a target D
r
of 40% at the end
of the consolidation stage. Effective confining pressures of 50,
100, and 200 kPa were applied, then samples were axially
loaded at CSR of 0.15, 0.225, and 0.30. Frequency of the cyclic
loading was 0.30 Hz and the applied loading function was
sinusoidal wave (Agaiby, 2011).
During cyclic loading, excess pore-water pressure (Δu) is
generated. The ratio of Δu to the initial σ′
c
is defined as the pore
pressure ratio, r
u
(r
u
= Δu/σ′
c
). If Δu increases until it reaches
σ′
c
, the specimen fails as the effective stress drops to zero
defining the onset of liquefaction at which r
u
= 1.0. Sometimes,
large strains may occur without reaching zero effective stress.
Accordingly, in studying the cyclic behavior of soils, failure
criterion is usually defined as the number of cycles required to
cause either liquefaction (r
u
= 1.0) or a specified axial strain (ε)
amplitude (ε = 5% according to Ishihara (1993)). For the tested
sand, the soil liquefied at relatively low strains (less than 5%).
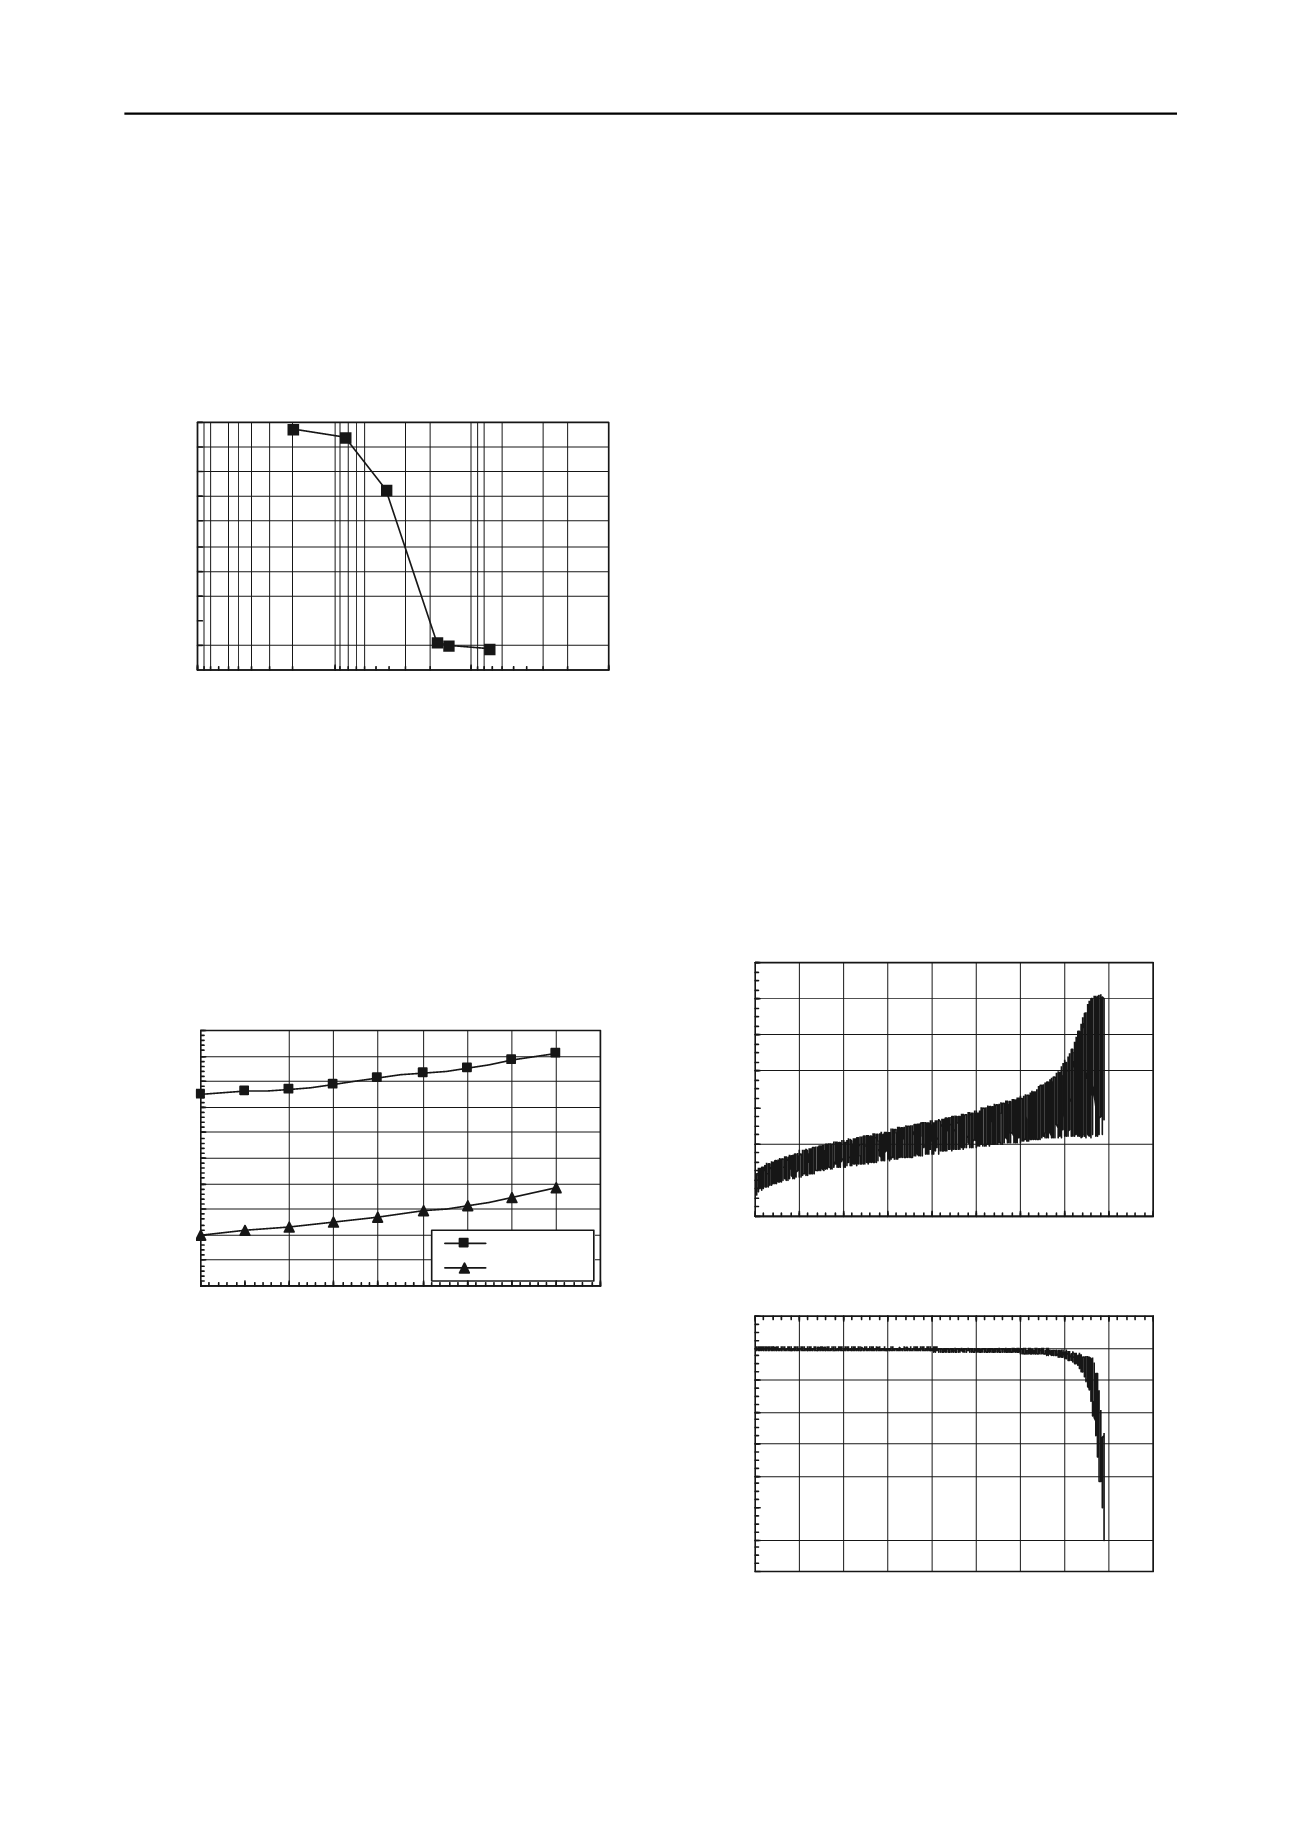
A typical response of the North Coast calcareous sand at D
r
of 40% subject to cyclic loading is presented in Figure (3). The
specimen was consolidated under σ′
c
of 100 kPa and was axially
loaded with a CSR of 0.225. During the first 140 cycles, though
the pore-water pressure gradually increased, the axial
accumulative strain remained relatively small (nearly 0.5%).
Between cycles number 141 and 152, the pore-water pressure
increased significantly until it reached the value of the initial σ′
c
(i.e., r
u
= 1.0), thus reaching liquefaction. This liquefaction
failure is typical for contractive calcareous and siliceous loose
sands (LaVielle, 2008; and Hussein, 2008).
-0.2
0.0
0.2
0.4
0.6
0.8
1.0
1.2
0 20 40 60 80 100 120 140 160 180
No. of Cycles
Pore Pressure Ratio, ru
-14
-12
-10
-8
-6
-4
-2
0
2
0 20 40 60 80 100 120 140 160 180
f
Axial Strain (%)
Figure 3. Typical behavior of North Coast calcareous sand subjected to
cyclic loading
Hardin's method (1985) was used to quantify the crushing of
the tested sand in cyclic triaxial tests. Hardin (1985) based his
measurements on the changes in the grain-size distribution
curve before and after test. He defined the relative breakage


