1035
Microscopic observation on compacted sandy soil using micro-focus X-ray CT
Observation microscopique par micro-tomographie à rayons X de sables compactés
Otani J., Mukunoki T.
Graduate School of Science and Technology, Kumamoto University, Kumamoto, Japan
Takano D.
Geotechnical Engineering Field, Port and Airport Research Institute, Yokosuka, Japan
Chevalier B.
Université Blaise Pascal, Clemont-Ferrand, France
ABSTRACT: It has been suggested based on the technical report of the damages on the recent heavy rains or
liquefaction after earthquakes that there are some numbers of local areas where the compaction of soils is not enough
and thus, the revision of the current compaction control has been expected. In this paper, the precise behavior or
mechanism of soil compaction was discussed using the results of micro-focus X-ray Computed Tomography (CT). A
series of model compaction test with sandy soils were conducted and this compacted soil was scanned at different step of
compactions. Here, not only visualization of the behavior using CT images but also more quantitative discussion such as
the spatial distribution of porosity in the soils were on the discussion after conducting image analysis of the CT images.
Finally, it is believed that all those findings are valuable information for reconsidering the way of compaction control for
the riverbank.
RÉSUMÉ : Les récents rapports techniques relatifs aux dommages consécutifs aux fortes précipitations ou à la liquéfaction post-
séisme suggèrent qu'il existe un certain nombre de zones localisées où le compactage des sols n'a pas été suffisant. Suite à ce constat,
une reconsidération des méthodes actuelles de contrôle de compactage est attendue. Dans cet article, les comportements et
mécanismes exacts du compactage des sols sont discutés à partir de résultats issus de la micro-tomographie à rayons X. Une série
d'échantillons compactés de sols sableux a été réalisée puis scannée à différentes étapes du processus de compactage. Les images
résultant de la tomographie ont permis une analyse du processus de compactage à la fois qualitative, portant sur la visualisation des
mécanismes, mais aussi quantitative, notamment vis-à-vis des variations du volume des vides dans les différents échantillons. Sur la
base des résultats obtenus, une discussion sur l'évolution de la répartition spatiale des vides dans l'échantillon a également été menée.
L'ensemble des résultats et observations représente une source d'information précieuse pour reconsidérer les méthodes de contrôle du
compactage des digues.
KEYWORDS: compaction, density, image analysis, sandy soil, X-ray CT.
1 INTRODUCTION
Compaction control for riverbanks is usually done by the
density of the soils no matter how difference on the design
criteria or soils is. However, it has been suggested based on the
technical report of the damages on the recent heavy rains or
liquefaction after earthquakes that there are some numbers of
local areas where the soil compaction is not enough and thus,
the revision of the current compaction control has been
expected. Under those circumstances, the goal of this study is
to develop a new quantitative compaction control for
riverbank. In this paper, the soils after compaction are precisely
investigated using micro-focus X-ray Computed Tomography
(CT) scanner which is the one of non destructive testing
methods with high resolution (Higo et. al. 2011). This
investigation makes the micro level of the discussion possible.
2 SUMMARY OF TESTING
In this test, micro-focus X-ray CT (TOSCANER-32300FPD,
Toshiba) at Kumamoto University was used and this apparatus
makes the micro level of discussion possible in the soils
without any destructions. A series of X-ray CT scanning were
conducted on the model ground under the process of
compaction to evaluate the change of soil property due to
compaction. A sandy soil called “Yamazuna” sand was used in
this study and Table 1 shows those of soil properties. As shown
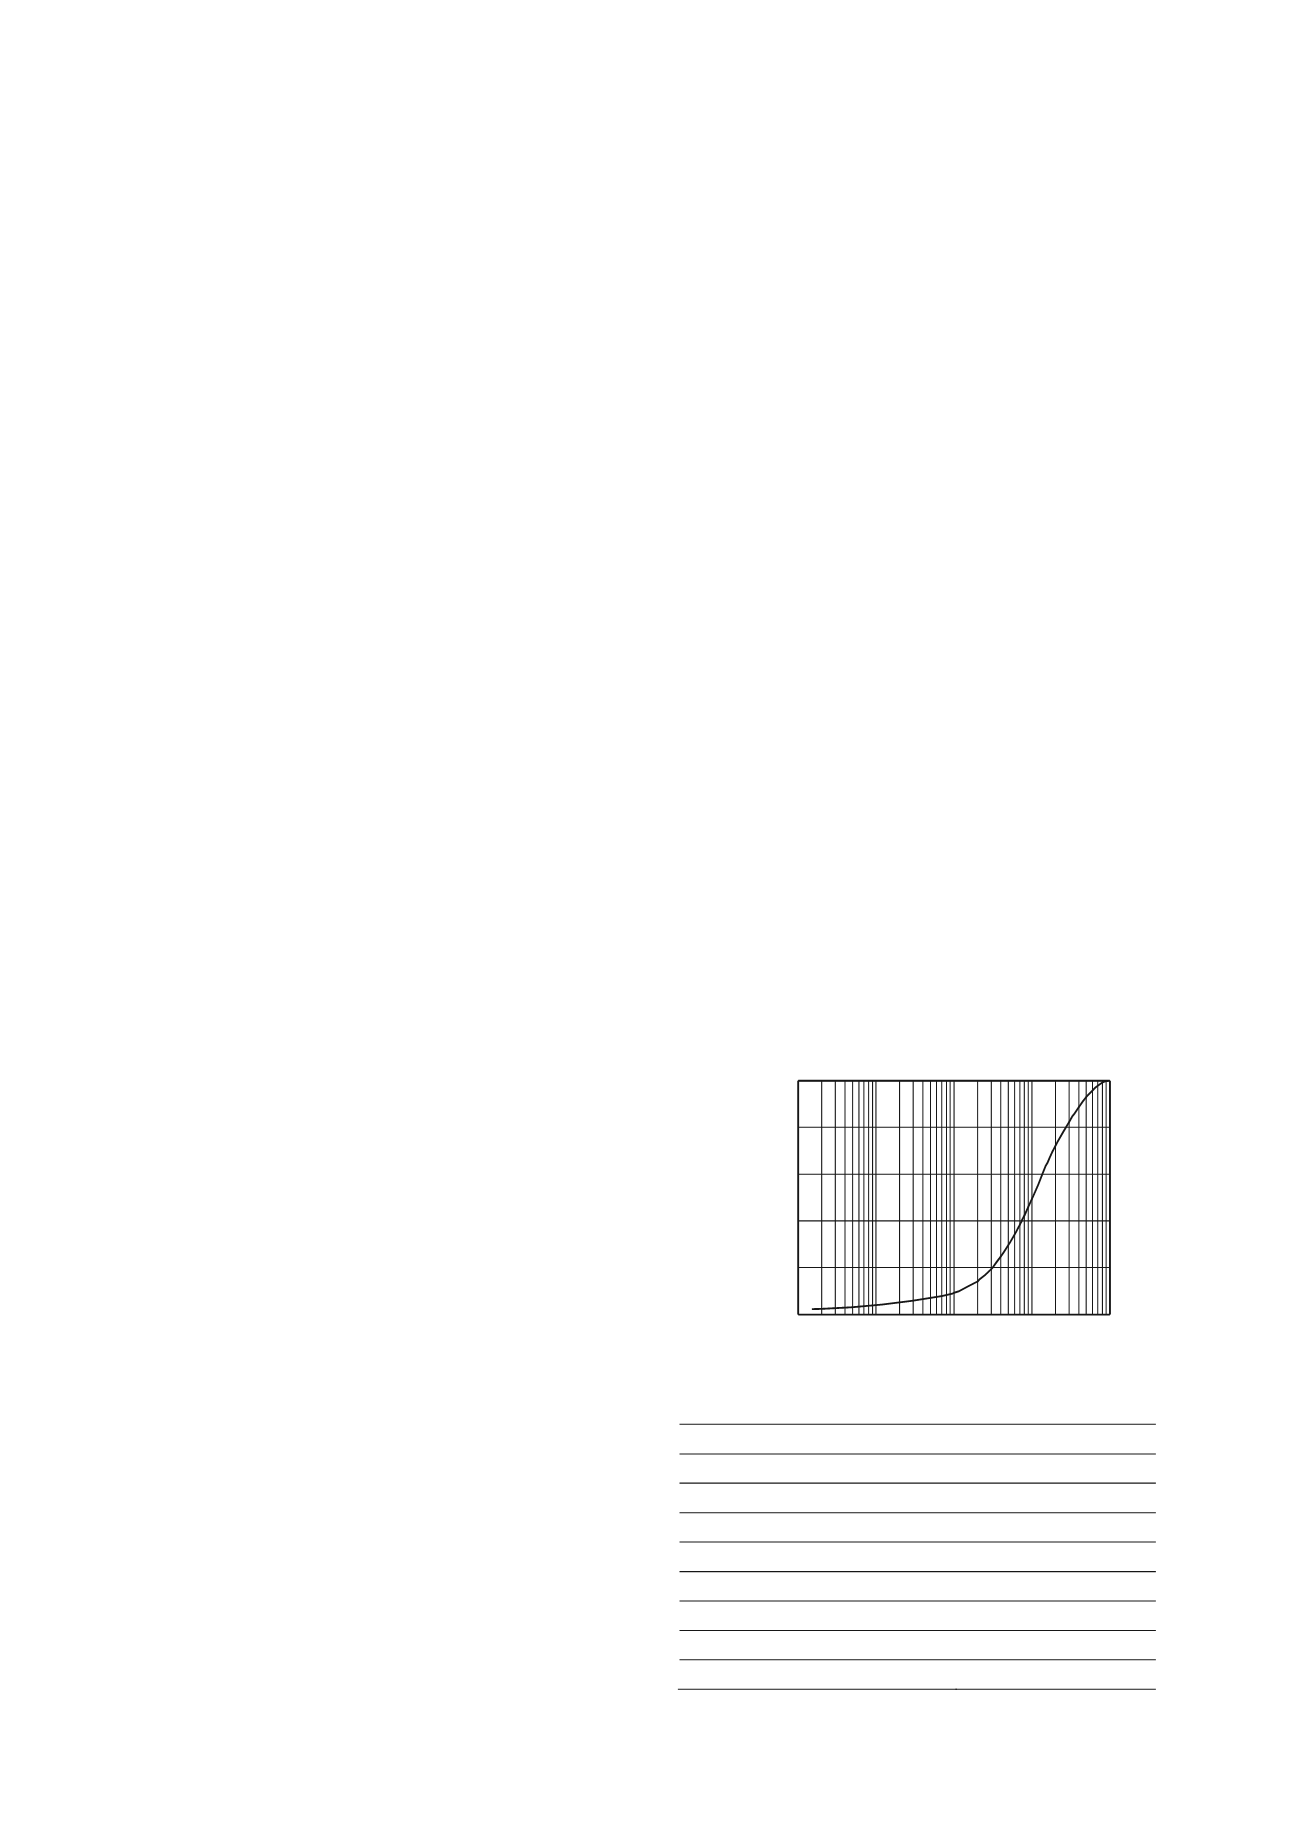
in Figure 1, “Yamazuna” sand has a wide range of the size of
soil particles, so that it can be suitable for soils in the riverbank.
100
80
60
40
20
0
0.001 0.01
0.1
1
10
Diameter (mm)
Percent finer by weight
(%)
Soil particle density (t/m
3
)
2.71
Figure 1. Particle size distribution of “Yamazuna” sand.
Table 1. Soil properties of “Yamazuna” sand.
Sand (%)
64.3
Silt (%)
4.9
Clay (%)
3.3
Uniformity coefficient
11.7
Coefficient of curvature
1.61
Classification
S-F
Optimum water content (%)
12.2
Maximum dry density (t/m
3
)
1.90


