 
          1071
        
        
          Technical Committee 106 /


            Comité technique 106


            Suction (kPa)


            10


            -1


            10


            0


            10


            1


            10


            2


            10


            3


            10


            4


            10


            5


            10


            6


            Volumetric water content


            0.0


            0.1


            0.2


            0.3


            0.4


            0.5


            0.6


            Clay


            Till


            Silt


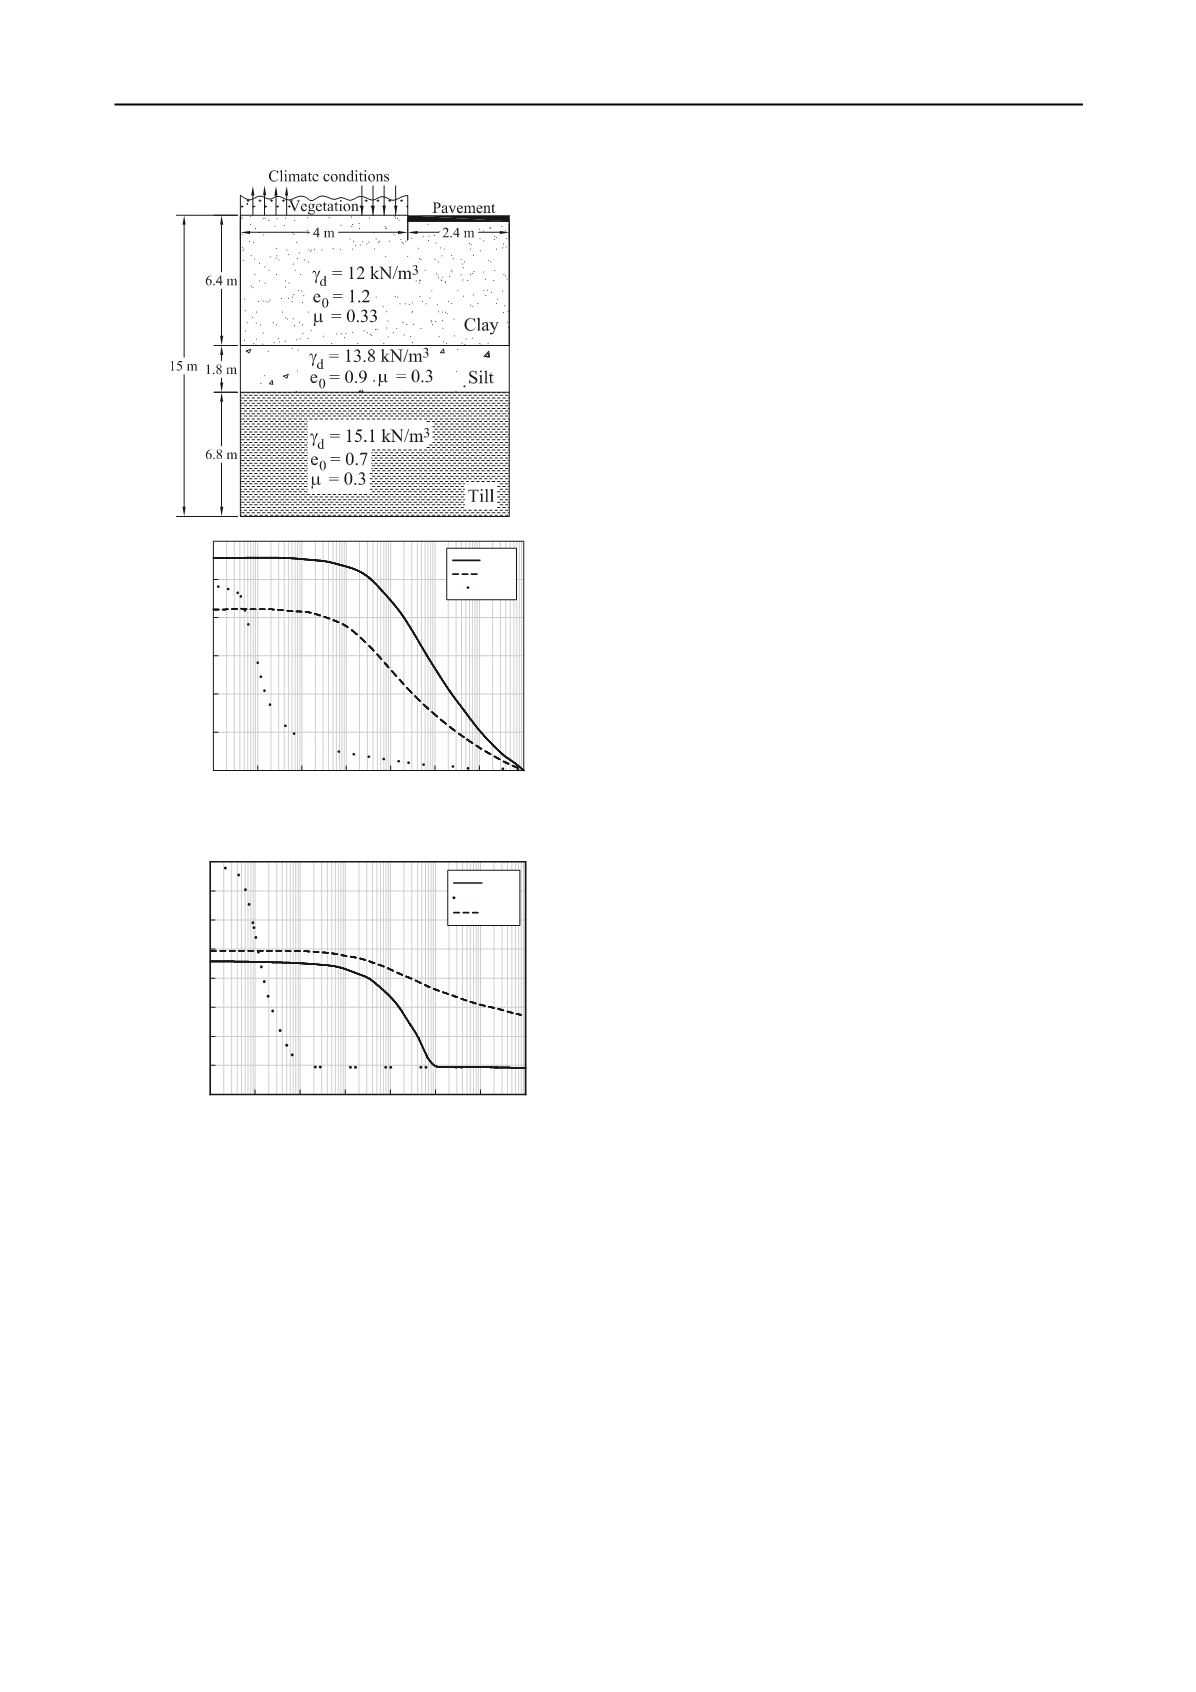
          Figure 2. Soil-water characteristic curves (Ito and Hu 2011)


            Suction (kPa)


            10


            -1


            10


            0


            10


            1


            10


            2


            10


            3


            10


            4


            10


            5


            10


            6


            Coefficient of permeability (m/day)


            10


            -8


            10


            -7


            10


            -6


            10


            -5


            10


            -4


            10


            -3


            10


            -2


            10


            -1


            10


            0


            Clay


            Silt


            Till


          Figure 3. Coefficient of permeability functions (Ito and Hu 2011)
        
        
          The climate and the vegetation data for the period of study
        
        
          were applied during the fully coupled transient analysis on the
        
        
          vegetated area only.
        
        
          A “no flow” natural boundary condition
        
        
          was applied in VADOSE/W by default on the pavement to
        
        
          represent the pavement as an impervious layer and moisture in
        
        
          and out flow are occurring through the vegetated area (see
        
        
          Figure 1)
        
        
          .
        
        
          In winter season (1 November, 2009 to 31 March,
        
        
          2010), the precipitation was received as snow. The cumulative
        
        
          snow precipitation was applied on a single day, when the
        
        
          temperature rose and remained above 0 °C (1 April, 2010). The
        
        
          climate data recorded at the Regina Airport weather station was
        
        
          used for the modeling. The climate in winter months was
        
        
          however set up to be constant. The temperature was assumed to
        
        
          be -5
        
        
          o
        
        
          C, the relative humidity as 100%, and the remainder of the
        
        
          climate data was zero. In other words, the model was not
        
        
          intended to simulate soil movement activities during winter.
        
        
          Because the site is located in a residential area with a park
        
        
          that has mature trees, the daily wind speed, precipitation and net
        
        
          radiation recorded at the weather station were multiplied by
        
        
          scale factors of 0.3, 0.7, and 0.3, respectively, as suggested by
        
        
          Ito and Hu 2011. Furthermore, a park watering rate of 1.8064 ×
        
        
          10
        
        
          -3
        
        
          m/day was applied on every Monday and Friday for the
        
        
          period from 23 June to 12 October as reported in Vu et al. 2007.
        
        
          However,
        
        
          water uptake by mature trees was not included in the
        
        
          modeling.
        
        
          Similar to Ito and Hu 2011, and Vu et al. 2007, the
        
        
          vegetation was specified as good grass and the growing season
        
        
          was assumed to start in April and end in October as suggested
        
        
          by Vu et al. (2007). The LAI function for good vegetation with
        
        
          a maximum LAI value of 2 was used as suggested in SoilCover
        
        
          (Unsaturated Soils Group 1996). The root depth of 150 mm was
        
        
          used as suggested and the root distribution was assumed to be
        
        
          triangular. A plant moisture limiting point of 500 kPa and a
        
        
          wilting point of 2500 kPa were used for this simulation.
        
        
          Mass balance checking was performed on the VADOSE/W
        
        
          run, and the model solved with a total mass balance error of less
        
        
          than 1.5%.
        
        
          Figure 4 shows the predicted soil suction response to a
        
        
          changing surface boundary over the entire year under the centre
        
        
          of the vegetation cover. The soil suction was found to vary with
        
        
          depth and time. It can be seen that the fluctuations in suctions
        
        
          correlated well with the environmental conditions on the surface
        
        
          boundary. The suction at the ground surface fluctuated widely
        
        
          and these fluctuations reduced with depth. The predicted
        
        
          suctions for this study agreed well with the results of Ito and Hu
        
        
          (2011). The correspondence between the suction values was
        
        
          accomplished using the same meteorological data (e.g.,
        
        
          precipitation, temperature), soils properties and initial boundary
        
        
          conditions.
        
        
          The corresponding suction profiles under the centre of the
        
        
          vegetation cover for various times were also investigated.
        
        
          However,
        
        
          due to limitations of the paper length, suction profiles
        
        
          are not provided in this paper
        
        
          . In general, extreme changes in
        
        
          suction (that vary between 600 and 2500 kPa) occurred at the
        
        
          ground surface. The suction values are typically greater at the
        
        
          surface during relatively dry periods. During infiltration, the
        
        
          suction values decreased at the surface, and it continued to
        
        
          decrease further as water infiltrated to greater depths. The
        
        
          suction fluctuations were predominant at the surface and
        
        
          approached minimum values at 3.4 m (which is the active zone
        
        
          depth). According to Azam and Ito (2012), this behavior was
        
        
          attributed to the surface soil layer that was initially at an
        
        
          unsaturated state and imbibed any water available by the
        
        
          infiltration. Likewise, the layer can rapidly lose water under
        
        
          relatively dry conditions. With increasing depth, the overlaying
        
        
          soil provides a cover and the geotechnical properties of the
        
        
          underlying materials become progressively more significant.
        
        
          The high water retention capability and the low coefficient of
        
        
          permeability of the Regina clay, especially under unsaturated
        
        
          conditions, impede the soil suction at higher depths to respond
        
        
          to the variations of the surface boundary. This soil-atmospheric
        
        
          interaction corroborated well with the suction values obtained
        
        
          from Ito and Hu (2011) thereby validating the VADOSE/W
        
        
          output that can be used for predicting the vertical movement of
        
        
          the test site with Regina expansive clay.


            4.2 Estimation of the vertical soil movements


          To calculate the vertical soil movements at different depths
        
        
          (0, 0.5, 1, 2, 3, and 6 m), the soil profile was divided into
        
        
          several sub-layers up to 6.4 m depth (which is the thickness
        
        
          of Regina expansive clay layer). The total vertical movement
        
        
          of the soil at a certain depth for a given day was computed
        
        
          by adding the vertical movements of all layers up to the
        
        
          considered depth using Equation 2. The soil compressibility
        
        
          modulus,
        
        
          s
        
        
          2
        
        
          m
        
        
          , was calculated using
        
        
          the Poisson’s ratio (μ =
        
        
          0.33) and the soil modulus of elasticity in terms of soil
        
        
          suction which was calculated using Equations 3 and 4.
        
        
          Vanapalli and Oh (2010) suggested the fitting paramete
        
        
          r, β,
        
        
          equals 2 for fine-grained soil, which was used for Regina
        
        
          expansive clay. The fitting parameter,
        
        
          α
        
        
          , was assumed to be
        
        
          1/12 in order to provide reasonable comparison between the
        
        
          predicted and the published results of the vertical soil
        
        
          under
        
        
          , P
        
        
          a
        
        
          =
        
        
          ree of
        
        
          sibility
        
        
          pect to
        
        
          ionship
        
        
          (4)
        
        
          omplex
        
        
          er, this
        
        
          s been
        
        
          Similar
        
        
          Ltd. for


            ion


          igration
        
        
          rtant in
        
        
          ls. The
        
        
          io, was
        
        
          on with
        
        
          rogram
        
        
          airport was applied at the vegetative cover over a period of one
        
        
          year (from 1 May, 2009 to 30 April, 2010). Figures 2 and 3
        
        
          show the SWCCs and the coefficient of permeability functions,
        
        
          respectively, for Regina and other materials used in the
        
        
          numerical modelling. Ito and Hu (2011) provide more details
        
        
          about the soil, the climate, and the vegetation data of the site.
        
        
          4 RESULTS AND DISCUSSIONS


            4.1 Estimation of the soil suctions


          The soil profile shown in Figure 1 was modeled using the
        
        
          fully coupled transient analysis with the 2-D software
        
        
          package (VADOSE/W) to estimate the suction changes
        
        
          associated with the environmental changes for a period of
        
        
          one year. Beside the soil properties, the initial and boundary
        
        
          conditions are needed as input data to run the program.
        
        
          The
        
        
          initial conditions for all nodes of the model domain, including
        
        
          pressure and temperature, were derived from implementing a
        
        
          steady-state analysis using the same model.
        
        
          Based on the field
        
        
          suction data measured by Vu et al. (2007),
        
        
          the
        
        
          initial
        
        
          pressure head
        
        
          during the steady-state analysis
        
        
          was set up to be
        
        
          -163.15 m for the top 3 m of the clay layer, -101.97 m for
        
        
          the rest of the clay, -61.18 m for the silt, and -203.94 m for
        
        
          the till. T
        
        
          he temperatures of nodes at the lower boundary were
        
        
          set up to be 10
        
        
          o
        
        
          C
        
        
          .
        
        
          Figure 1. Soil profile and soil properties (Ito and Hu 2011)