2669
Technical Committee 212 /
Comité technique 212
methods, while offering good agreement with the more rigorous
3D computational methods for certain pile-soil configurations.
However, the solution cannot easily model pile installation
effects or soil-pile separation. Additionally, variation of the soil
profile below the pile tip is not included in the formulation. The
formulation was programmed in MATLAB for use in this study.
More details on the theoretical approach can be found Novak
and Aboul-Ella (1978).
3 PARAMETRIC STUDY AND RESULTS
The measured vibration data from full-scale tests were used in
an inverse-analysis framework to calibrate the theoretical soil-
pile model and identify the optimum values for each parameter
in the solution. A sensitivity analysis was first conducted to
determine the relative influence of the various parameters and
estimate their possible range of variation for modeling the
experimental observations. The properties of the pile-cap and
shaker are known relatively accurately, and were therefore
determined not to play a major role in the sensitivity analysis.
Attention was thus focused on the soil-pile interaction
unknowns, including contact conditions and gapping near the
surface, and profiles of soil shear modulus and damping. The
parametric studies indicated that the un-embedded length of the
pile can have a significant effect on the accelerance. Although
the free un-embedded length of the pile can be measured
accurately, slight gapping was observed in the field for pile U.
The sensitivity of accelerance to gapping effects was
therefore examined by increasing the length of the free pile stem
in the theoretical accelerance calculation, while decreasing the
embedded pile length accordingly in the approximate 2D soil-
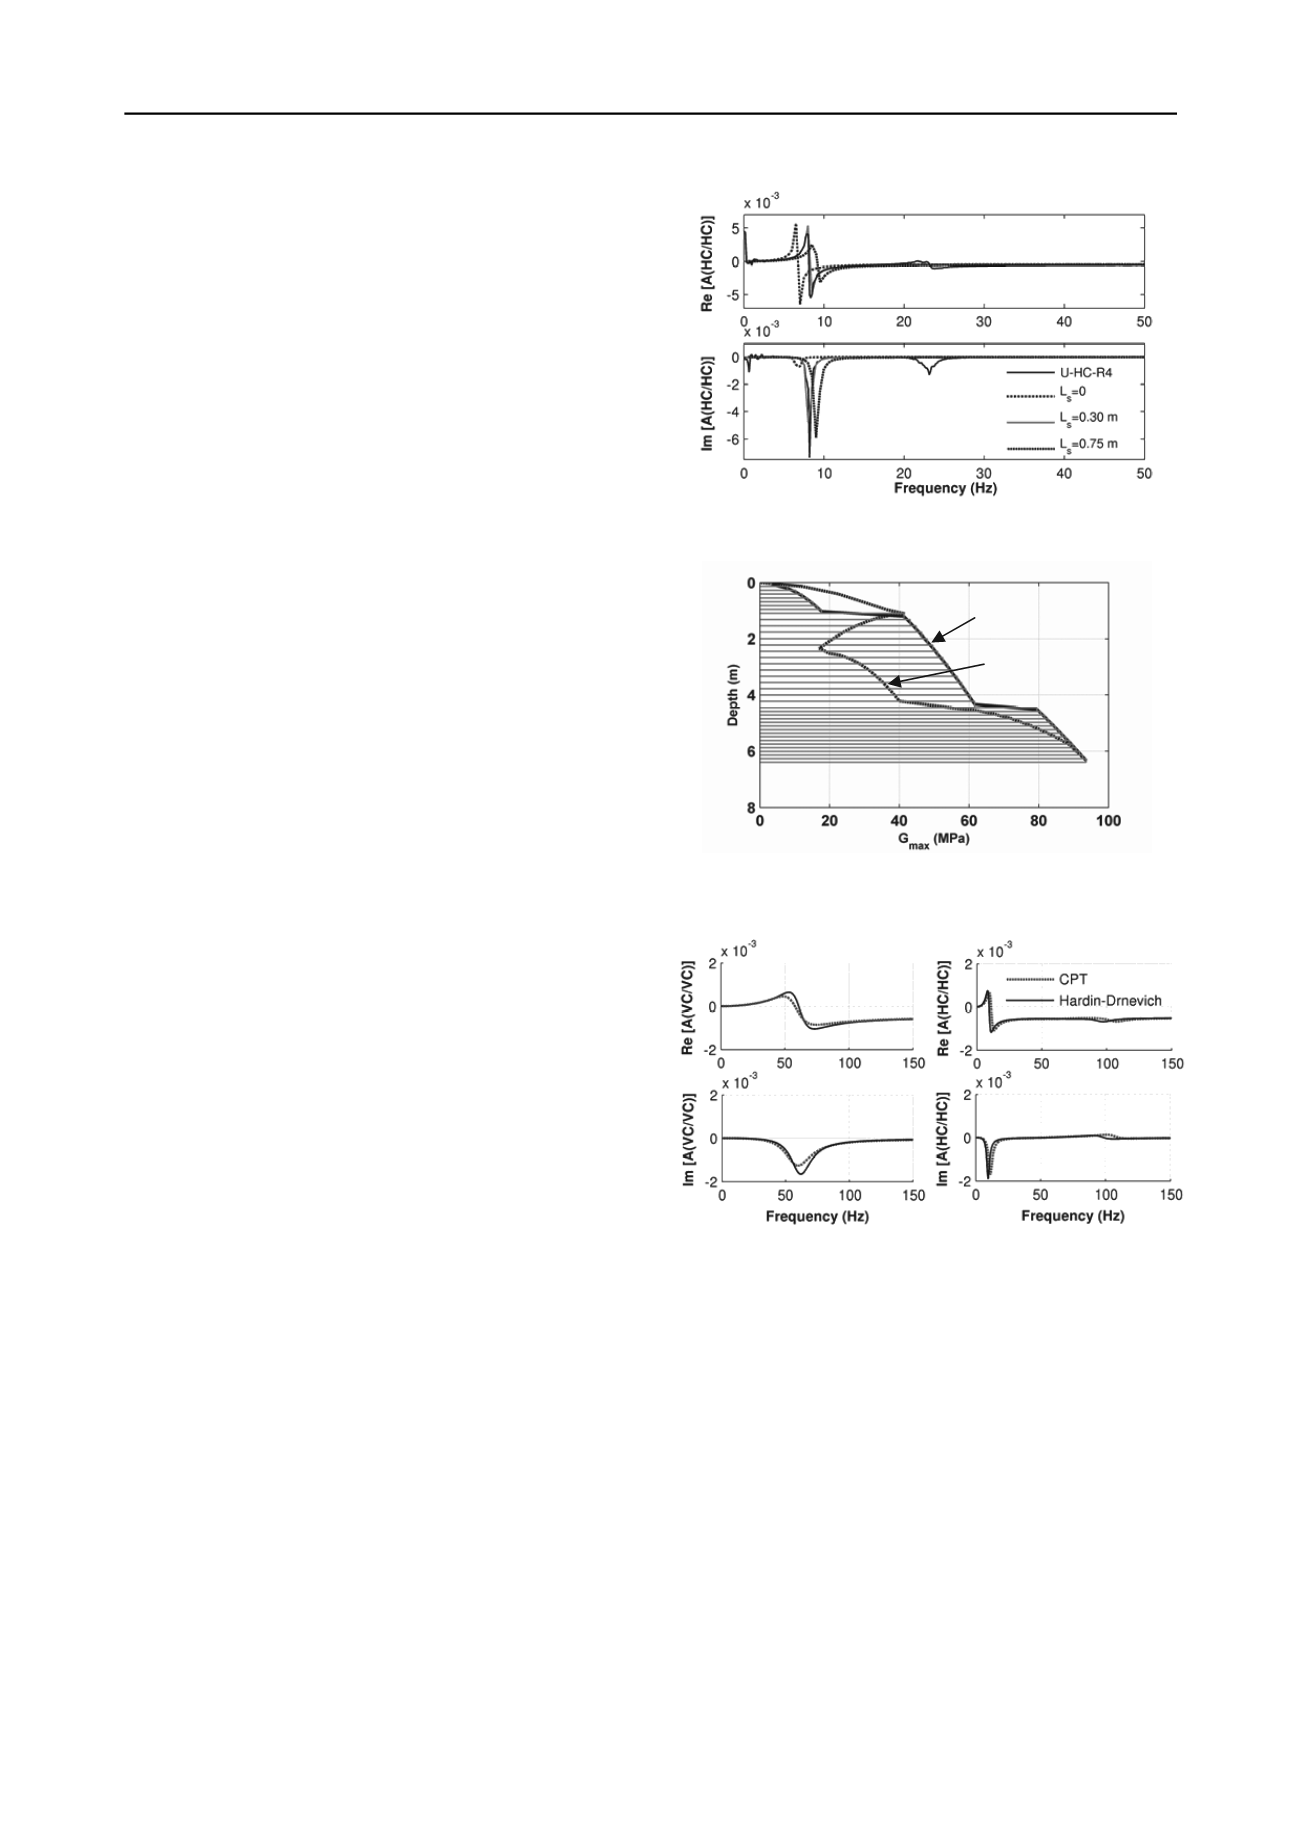
pile impedance model. Figure 4 illustrates the effect of gapping
on the theoretical accelerance, shown relative to the
experimental HC/HC response for test U-HC-R4. As indicated
in this figure, a 0.3 m soil-pile separation depth was found to
produce an improved fit of the first experimental horizontal-
rocking peak. Due to the non-destructive elastodynamic nature
of the tests, the gapping depth was not observed to vary
significantly between tests. Gapping was not observed for pile I
in the field, likely due to its vibratory installation while the
CDSM zone was still in a liquid state.
Figure 5 depicts the two shear modulus soil profiles that
were used in the study of the unimproved soil-pile system. The
profile labeled “CPT” was calculated from the CPT data using
correlations to shear wave velocity presented in NCHRP
Synthesis 368 (Mayne, 2007). Since correlations between CPT
resistance and shear-wave velocity are not precise, the input
values for the soil modulus are expected to incur some degree of
error. Therefore, a second shear modulus profile based on
Hardin and Drnevich (1972) was also examined, as shown in
Figure 5. To model the soil damping profile, only three major
layers corresponding to those shown in Figure 1 were
distinguished along the length of the pile, compared to 38 finer
layers used in shear modulus profiles.
Figure 6 demonstrates the effect of the two shear modulus
profiles on the theoretical vertical and horizontal-rocking
responses in VC and HC tests, respectively. The CPT profile
generates a softer response in the vertical mode of vibration
while yielding a slightly increased stiffness for the horizontal
mode. This may be expected as the CPT-based modulus profile
Figure 4. Effect of soil-pile separation depth on HC/HC response for
pile U in native unimproved soil.
Figure 5. Two 38-layer shear modulus profiles used in the analyses
based on interpretation of field CPT data and Hardin and Drnevich
(1972).
Hardin and Drnevich
CPT
is softer overall, but is stiffer near the surface region which has
a greater influence on the bending behavior.
Both the vertical and horizontal rocking modes of the pile in
the native unimproved soft clay can be nearly captured using the
Hardin & Drnevich shear modulus profile together with the
0.30 m separation zone, but require application of scale factors
to the modulus and damping within the three major layers
shown in Figure 1. Figure 7 illustrates such a comparison using
modulus reduction factors of 0.8, 0.8 and 0.5 for the top, middle
and bottom layers, respectively, while increasing the damping in
all layers by a factor of 10. The peak frequency of the vertical
mode is fit reasonably well, but the experimental vertical
response exhibits some deviation from the theoretical solution at
higher frequencies. This is assumed to be a relic of a higher
mode of the shaker’s stationary base frame which does not
behave as a perfectly rigid body. The first peak for the
horizontal response matches very well, although this is difficult
to see in Figure 7 as the experimental and theoretical curves are
nearly coincident at this frequency.
Figure 6. Effect of the two shear modulus profiles of Figure 5 on
theoretical vertical response (left) and horizontal response (right).


