 
          1307
        
        
          Technical Committee 202 /


            Comité technique 202


          0.0 0.2 0.4 0.6 0.8 1.0 1.2 1.4 1.6 1.8
        
        
          0
        
        
          20
        
        
          40
        
        
          60
        
        
          80
        
        
          100
        
        
          120
        
        
          140
        
        
          2.0


            k


          2


            k


          2
        
        
          u
        
        
          2
        
        
          1
        
        
          st
        
        
          cycle
        
        
          Applied pressure,


            p


          (kN/m
        
        
          2
        
        
          )
        
        
          Settlement of sleeper,


            S


          (mm)
        
        
          0
        
        
          20
        
        
          40
        
        
          60
        
        
          80
        
        
          0.0
        
        
          0.1
        
        
          0.2
        
        
          0.3
        
        
          0.4
        
        
          0.5
        
        
          100
        
        
          Before tamping
        
        
          After tamping
        
        
          M sand


            u


          2
        
        
          (mm)
        
        
          No of loading cycles,


            N


          30%
        
        
          100
        
        
          0
        
        
          20
        
        
          40
        
        
          60
        
        
          80
        
        
          3.0
        
        
          2.5
        
        
          2.0
        
        
          1.5
        
        
          1.0
        
        
          0.5
        
        
          0.0
        
        
          Settlement after 100 loading cycles,


            S


          100
        
        
          (mm)
        
        
          Amount of sand (%)
        
        
          Before Tamping
        
        
          After Tamping
        
        
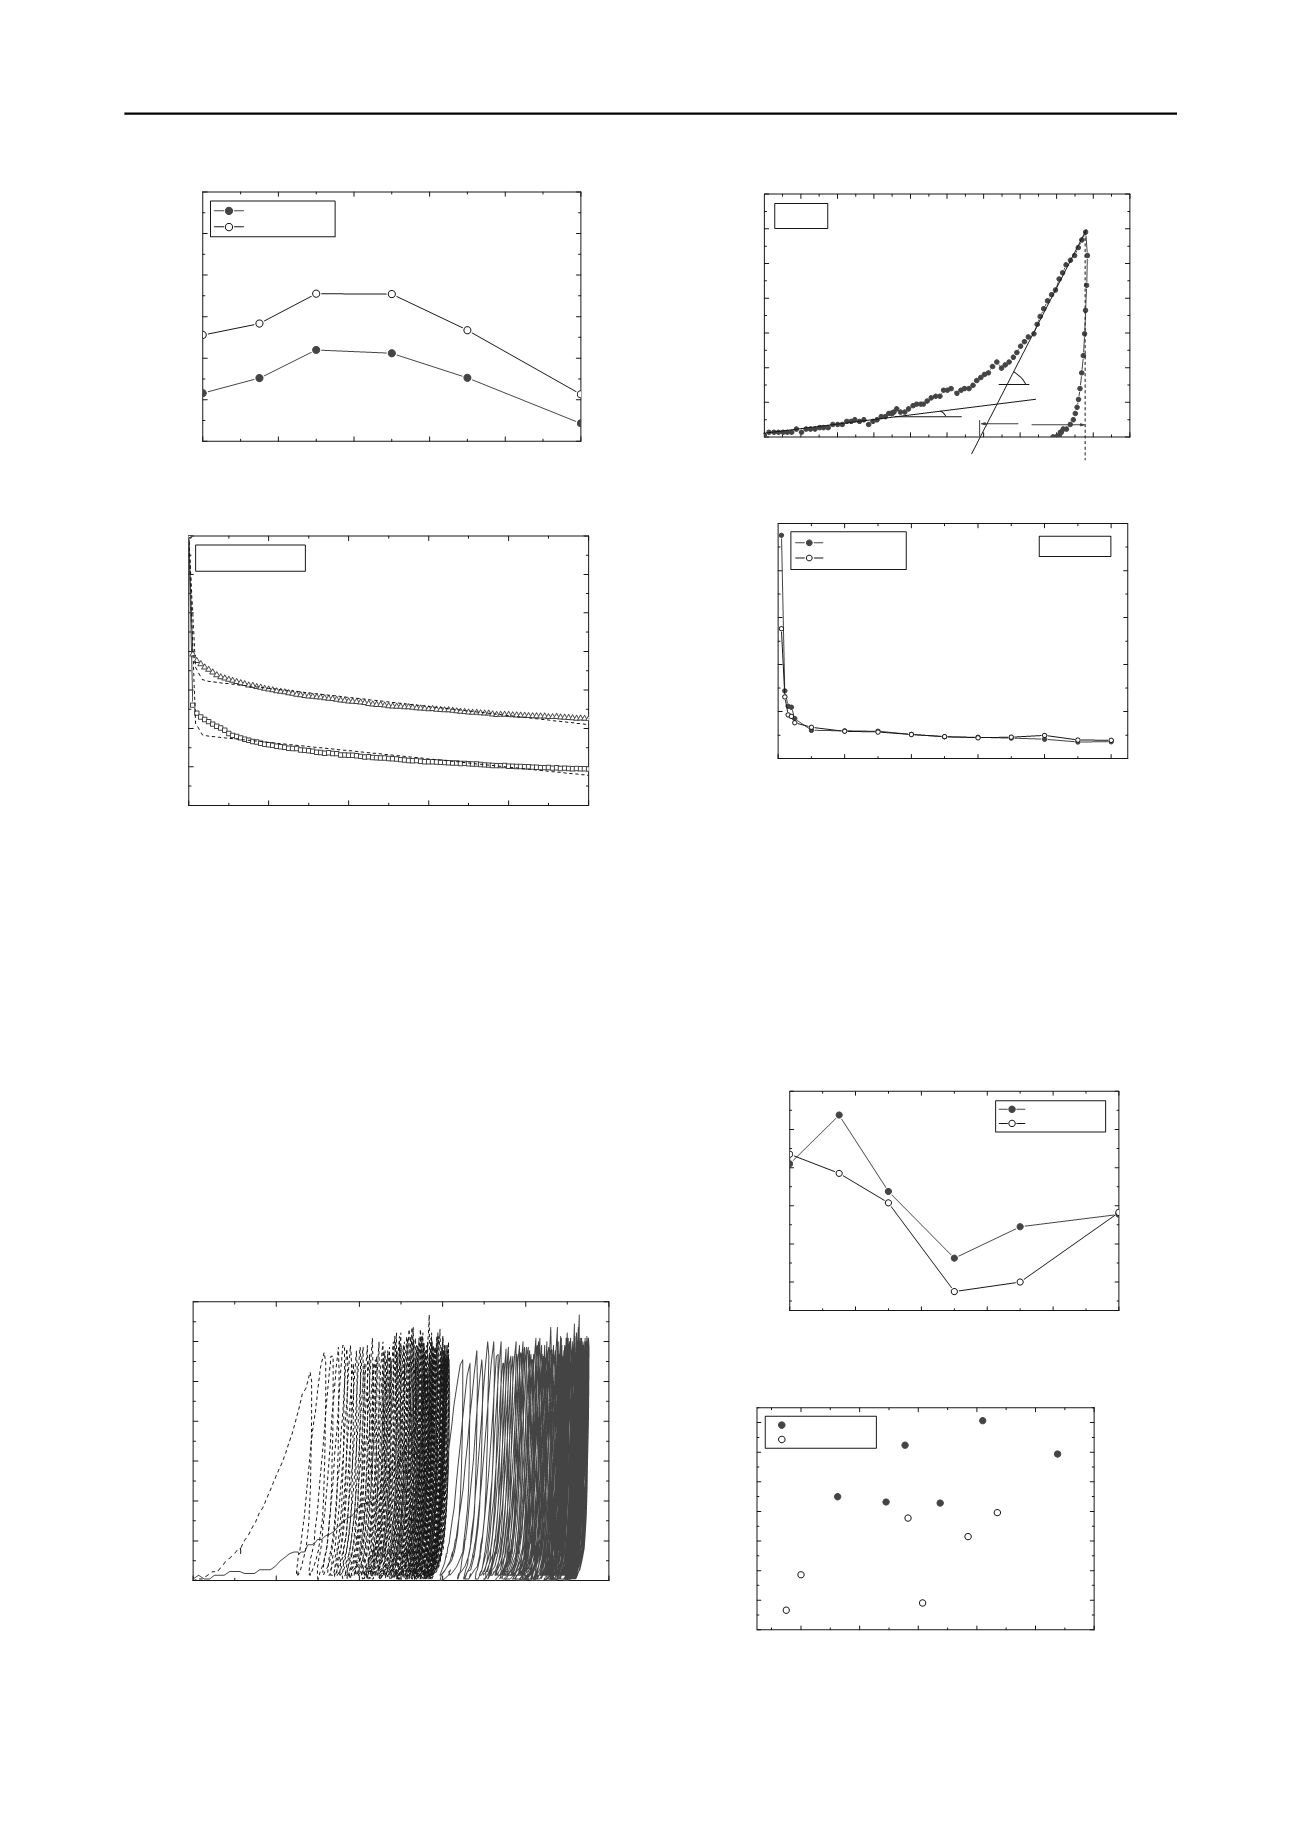
          Figure 7. The settlement at 100 loading cycle vs. % sand
        
        
          Figure 8. Relationships between


            S


          and


            N


          for fresh ballast and 30% sand
        
        
          cases (before tie tamping application)


            3.2 Effects of roadbed stiffness on settlement characteristics


          Figure 9 shows typical relationships between sleeper settlement
        
        
          and applied stress,


            p


          (30% sand case is shown here). It can
        
        
          clearly be seen that settlement reduces in the 2
        
        
          nd
        
        
          phase (i.e.,
        
        
          after tie tamping application), due to densification of the
        
        
          specimen in the 1
        
        
          st
        
        
          phase (i.e., before tie tamping application
        
        
          with 100 loading cycles).
        
        
          In this research, the loading curves were fitted by bilinear lines,
        
        
          and the slopes of the two lines were estimated as


            k


          1
        
        
          and


            k


          2
        
        
          as
        
        
          shown in Figure 10. Displacement


            u


          2
        
        
          was estimated by dividing
        
        
          the applied stress by


            k


          2
        
        
          as shown in Figure 10. The parameter


            u


          2
        
        
          decreases and tends to show a constant value with


            N


          as shown
        
        
          in Figure 11. Therefore, these constant values were used in the
        
        
          following discussion.
        
        
          Figure 9. Applied stress vs. settlement for 30% sand case
        
        
          Figure 10. Calculation of


            u


          2
        
        
          (Gravel specimen)
        
        
          0
        
        
          20
        
        
          40
        
        
          60
        
        
          80
        
        
          2.8
        
        
          2.4
        
        
          2.0
        
        
          1.6
        
        
          1.2
        
        
          0.8
        
        
          0.4
        
        
          0.0
        
        
          100


            S


          30%
        
        
          = 1.49(1 - e
        
        
          -1.44


            N


          ) + 0.0047


            N


            S


          0%
        
        
          = 2.06(1 - e
        
        
          -1.67


            N


          ) + 0.0043


            N


          Before Tamping
        
        
          30% sand
        
        
          Fresh ballast
        
        
          Settlement,


            S


          (mm)
        
        
          No of loading cycles,


            N


          Figure 11. Relationships of


            u


          2
        
        
          and


            N


          (30% sand case)
        
        
          The relationships between


            u


          2
        
        
          with %sand,


            c


          ,


          and


          before and
        
        
          after tie tamping application are shown in Figures 12-15
        
        
          respectively. Figure 12 shows that 50% sand specimen is the
        
        
          densest specimen (i.e., showing the smallest


            u


          2
        
        
          ). Figure 13
        
        
          shows that


            c


          increases with


            u


          2
        
        
          (though not very clearly),
        
        
          indicating that loose specimen will result in higher initial
        
        
          settlement, in both before and after tie tamping application.
        
        
          Figure 14 shows that initial settlement period alter by tie
        
        
          tamping application with a wider gap between the highest and
        
        
          smallest


          compared to those of before tie tamping application.
        
        
          0
        
        
          20
        
        
          40
        
        
          60
        
        
          80
        
        
          0.036
        
        
          0.040
        
        
          0.044
        
        
          0.048
        
        
          0.052
        
        
          0.056
        
        
          100


            u


          2
        
        
          (mm)
        
        
          Amount of sand (%)
        
        
          Before Tamping
        
        
          After Tamping
        
        
          0.0
        
        
          0.4
        
        
          0.8
        
        
          1.2
        
        
          1.6
        
        
          2.0
        
        
          0
        
        
          20
        
        
          40
        
        
          60
        
        
          80
        
        
          100
        
        
          120
        
        
          140
        
        
          After tamping
        
        
          Before tamping
        
        
          Applied stress,


            p


          (kPa)
        
        
          Settlement,


            S


          (mm)
        
        
          Figure 12. Relationships of u
        
        
          2
        
        
          and% sand
        
        
          0.036
        
        
          0.040
        
        
          0.044
        
        
          0.048
        
        
          0.052
        
        
          0.056
        
        
          0.6
        
        
          0.8
        
        
          1.0
        
        
          1.2
        
        
          1.4
        
        
          1.6
        
        
          1.8
        
        
          2.0


            c


            u


          2
        
        
          (mm)
        
        
          Before Tamping
        
        
          After Tamping
        
        
          Figure 13. Relationships of


            u


          2
        
        
          and


            c