


 91 / 479

Proceedings of the 18
th
International Conference on Soil Mechanics and Geotechnical Engineering, Paris 2013, volume 6, 2016
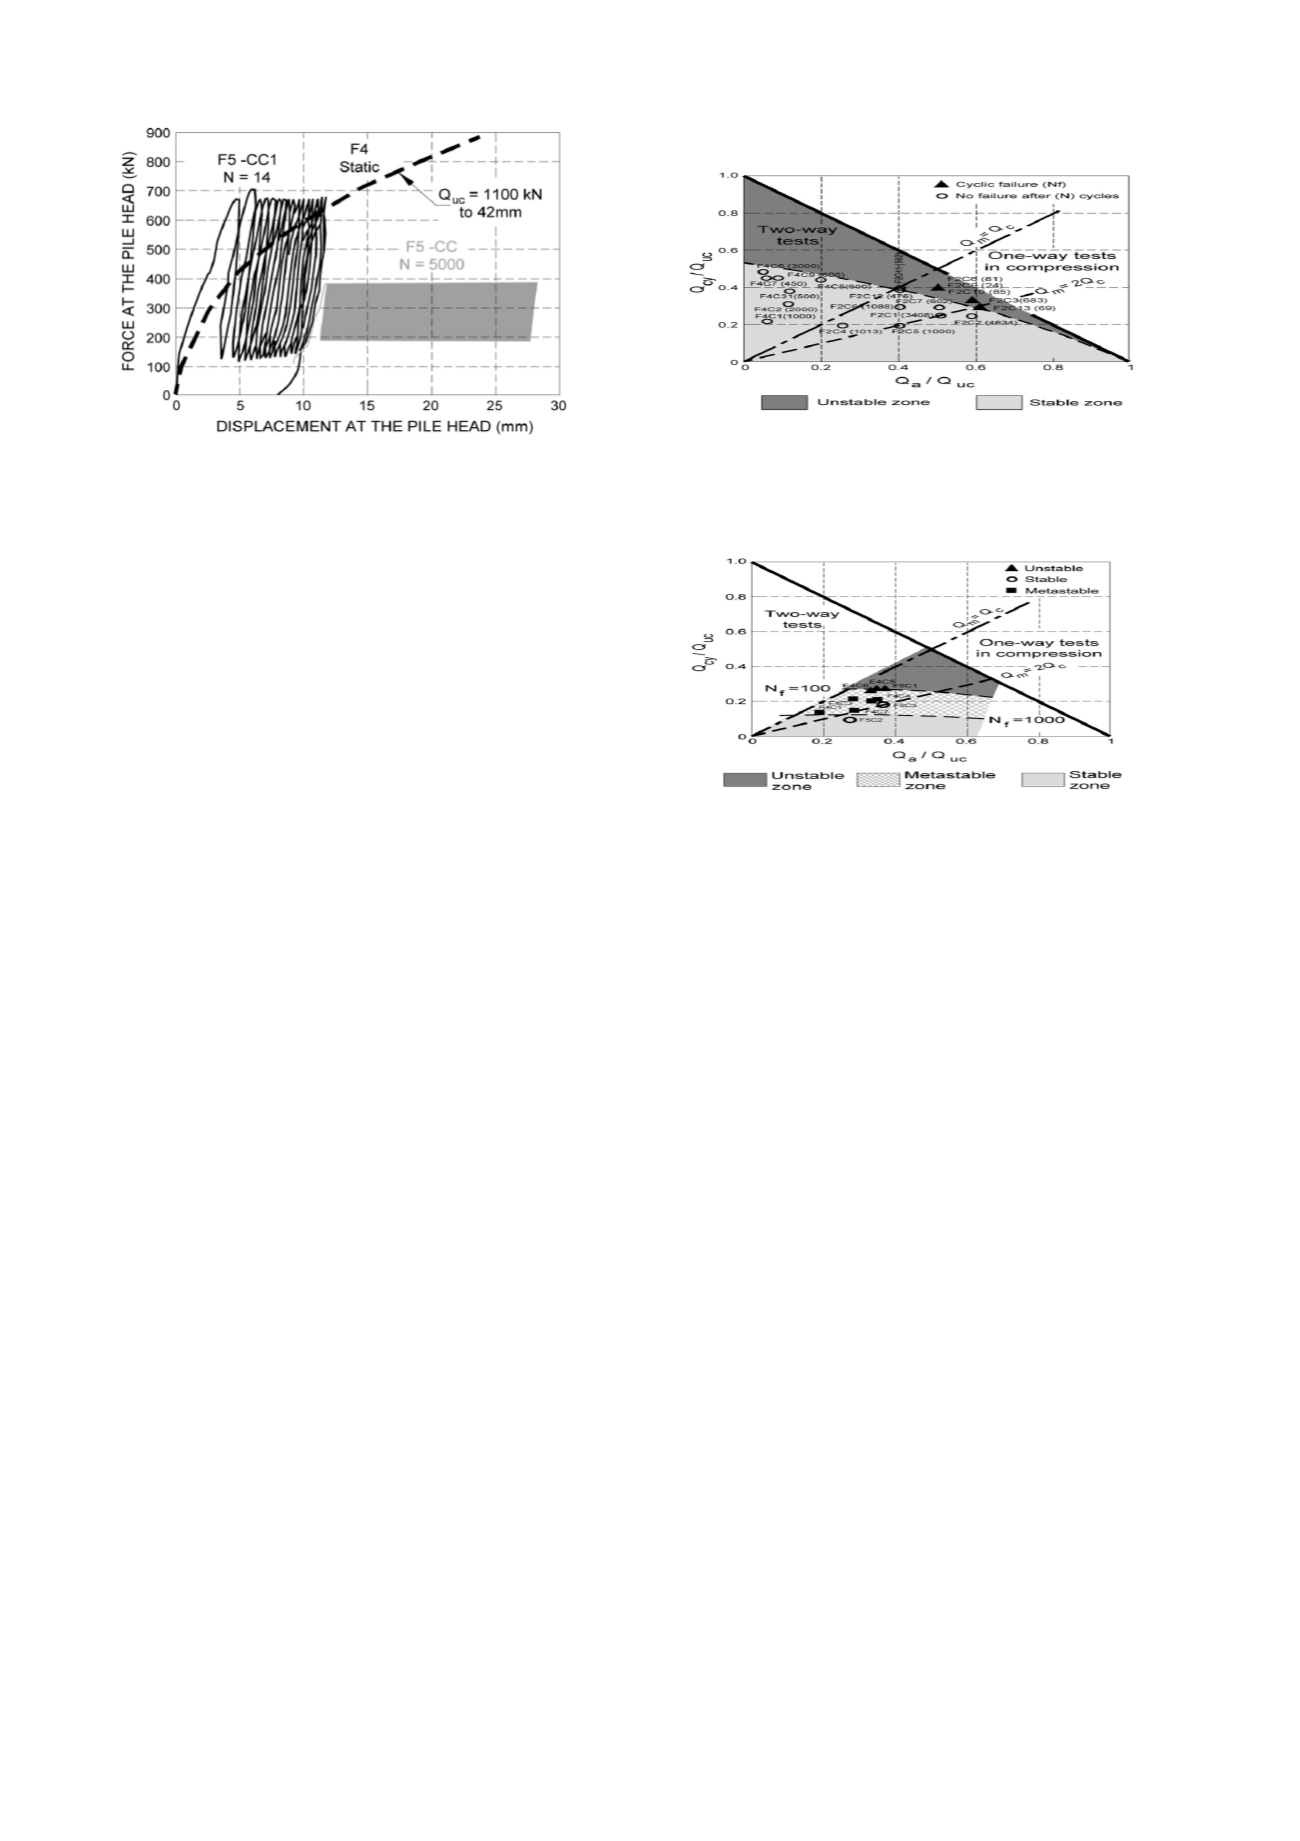
Fig. 18: Force-displacement relations at the pile head during repeated
compression tests on the bored F5 pile at Merville (according to Benzaria
et al.
, 2013b) - Comparison with the standard static test on pile F4
8.2.4
Cyclic stability diagrams
The result of a cyclic pile test may be more effectively
summarized using a cyclic interaction diagram. Each test is
depicted on a Q
cy/
Q
us
diagram by a point relative to Q
a
/Q
us
, with:
Q
cy
= half of cyclic amplitude; Q
a
(= Q
m
) = average load; and
Q
us
= ultimate reference static load. Q
us
is determined based on a
standard static test conducted in either compression (Q
uc
) or
tension (Q
ut
) depending on the tested loading mode. Each point
is assigned the number of cycles (N
f
) required for the pile to fail
according to a given criterion or else the total number of cycles
applied to the pile. Once a sufficient number of tests have been
completed (on the order of 10 or 20), it is possible to delimit
those zones where pile stability is guaranteed for a certain
number of cycles and other zones where cyclic failure is
obtained after a smaller number of cycles. An appropriate term
to employ would thus be "cyclic stability diagram".
One fundamental contribution of the SOLCYP project is to
have generated cyclic stability diagrams for various types of
piles: driven, bored CFA, and screwed; driven into
overconsolidated clays and dense sands; with one-way loadings
(in both compression and tension) and two-way loadings; and by
applying high numbers of cycles (up to 10,000 per series). These
diagrams were derived not only from
in situ
tests on
experimental piles, but also from tests on model piles.
For purposes of illustration, let's provide two diagrams, one
obtained on bored piles in Flanders clay the other in the dense
sands of Dunkirk.
In the Flanders clay, as indicated above, the transition
between stable and unstable zones occurs very suddenly; it is
reflected by a single distinct line in the stability diagram of
Figure 19. This line reveals the dependence of the critical
loading threshold on the average load value. It has been verified
that in the regime of one-way tests, the threshold lies at high
values of Q
max
= Q
a
+Q
cy
(i.e. Q
max
/Q
uc
> 0.8). In the two-way
mode, the zone of instability could not be explored, leaving the
dashed line to appear like a conservative envelope highlighting
the stable zone.
The stability diagrams in sands were determined by setting the
static capacity measured just before the considered cyclic
sequence as the static reference load and then adopting a cyclic
pile failure criterion equal to 3% of relative displacement at the
top.
Fig. 19: Cyclic stability diagram for a pile bored in the overconsolidated
Flanders clay at the MERVILLE site (Benzaria, 2012)
Fig. 20: Cyclic stability diagram for a pile bored in dense Dunkirk sand
at Loon-Plage (Puech
et al.
, 2013)
Figure 20 shows the cyclic stability diagram of bored piles at
LOON-PLAGE (Puech
et al.
, 2013); it serves to define the three
following zones:
-
an
unstable
zone in which piles quickly progress towards
failure (N
f
< 100);
-
a
stable
zone corresponding to low-amplitude cyclic loadings
in which the piles are able to withstand over 1,000 cycles
without accumulating significant permanent displacements;
-
an intermediate, so-called
metastable
zone in which the pile
accumulates large displacements or reaches cyclic failure
between 100 and 1,000 cycles.
The greater sensitivity to cyclic loadings exhibited by sands is
clearly apparent. Let's note that a test series on model piles in a
centrifuge, where eight cast piles had been introduced into the
same container of dense Fontainebleau sand and loaded on a
one-time basis (i.e. a single static or cyclic test per pile), yielded
a stability diagram nearly identical to that of the LOON-PLAGE
bored piles.
The SOLCYP results reveal that the cyclic response of piles
depends to a greater or lesser extent on: pile type, soil
conditions, loading mode, and loading history.
8.2.5
Design methodology in the presence of cyclic axial loading
The comprehensive design of a pile subjected to cyclic axial
loadings might rely on a set of relatively complex procedures
that do not always need to be justified by day-to-day practices.
SOLCYP has favored proposing various approaches, in offering
increasing levels of complexity and developing criteria to
determine which level of analysis is the most appropriate given
the case under consideration.
The
cyclic stability diagram
, as described above, is a most
attractive tool for identifying the critical loading cases that
justify a specific and relatively in-depth analysis (Jardine
et al.
,
Volume 6 - Page 91