


 280 / 479

Proceedings of the 18
th
International Conference on Soil Mechanics and Geotechnical Engineering, Paris 2013
Report from the Vice-President of ISSMGE for South America
Roberto Terzariol
ISSMGE Vice-President for South America
1
INTRODUCTION.
The ISSMGE Vice President for South America is Professor
Roberto Terzariol. His terms end in 2013. Currently is Dean of
the School of Engineering at the National University of
Córdoba. He is also Leading Professor at the National
Technological University where he taught Foundation
Engineering. Teaches courses of geotechnical engineering for
Masters and Doctoral degree from several universitys in
Argentinan and in an active consultant on Geotechnical
Engineering projects.
2
SOUTH AMERICAN REGION
It is necessary to explain where we are, who we are, where we
fit into the ISSMGE, which is our present, and which are the
future challenges.
2.1
Where we are
The South American Region is located from the Central to the
Southern part of the American continent. The region includes
countries from Central America, Caribbean and South America,
both speaking Spanish and Portuguese. The distance to the other
regions ranges between 8.500 and 18.000 kms, and the
maximum distance from one end to the other of the region is
8.000 km. This is a problem that hinders communication and
exchange between the member Societies. Our region is the only
one split between two continents.
2.2
Who and how many we are
The region has more than 1300 members in the ISSMGE, and
they contributed approx. 6% approx. of the total ISSMGE`s
subscriptions in 2009. Members of the region, from Argentina,
Brazil, Chile and Peru, work in more than ten TCs, such as
“Unsaturated soils”, “Laboratory testing”, “Underground
construction” and others, with a significant involvement in each
one. The chair of “Megacities” TC, is located in the region
(Prof. A. Negro of Brazil). Prof. Victor de Mello, President of
the Brazilian Society and formerly VP for South America, was
one of the more representative presidents of the ISSMGE. The
region is composed of 13 member Societies representing as
many countries. Some of them are very old, such as the
Argentinian Society which is 62 years old, and some very
recent, e.g. the Dominican Society created just 3 years ago.
There are now three countries that have shown interest in
joining the ISSMGE. Guatemala has already completed the
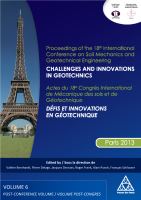
paperwork and became a new member. The table shows a list of
the constituted Societies, their name, and the authorities of each
one.
Table 1 - List of Societies of SA Region
Society Denomination
President
Period
Sociedad Argentina de Ing.
Geotecnica
A. Sfrisso
2013-2015
Asociación Boliviana de Geotecnia
R. Barrientos
s/d
Asociacao Brasileira de M. dos
Solos
A. Asis
2013-2014
Sociedad Chilena de Geotecnia
R. Verdugo
2011-2013
Sociedad Colombiana de Geotecnia
C. Torres
2012-2014
Asociación Costarricense de
Geotecnia
M. Tapia
2011-2013
Com. Tec. Nac. de M. de Suelos y
Geot. Cuba
R. Armas N.
s/d
Soc. Dominicana de Geotecnia y
Mat.
L. Carpio M.
2007-2013
Soc. Ecuat. de M. de Suelos y Rocas D. Stay Coello
2013-2015
Sociedad Salvadoreña de Geotecnia
L. Pineda
2012-2014
Sociedad Paraguaya de Geotecnia
R. Mena
2011-2013
Sociedad Peruana de Geotecnia
C. Torres
2010-2014
Sociedad Venezolana de Geotecnia
A. Benarroch
2012-2013
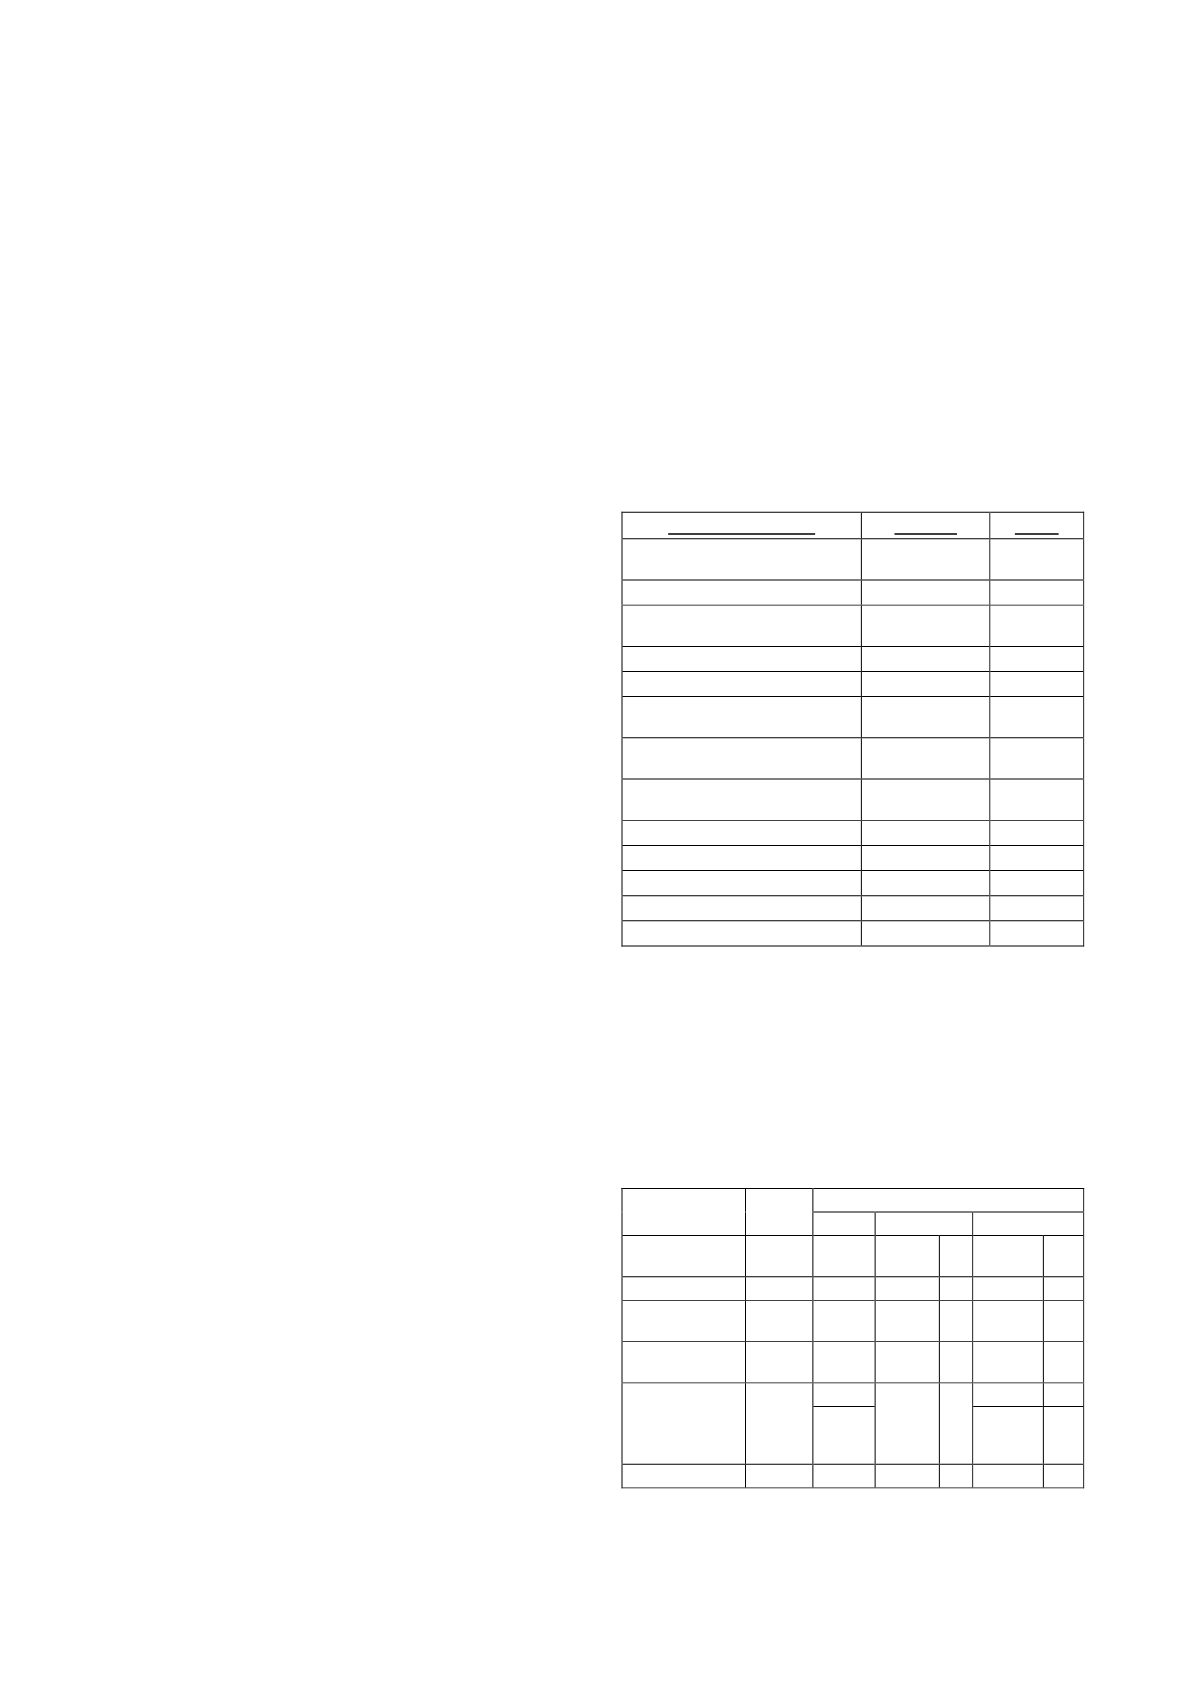
The average in South America is 3.5 members per million
inhabitants and in the whole ISSMGE this ratio is 11 approx. In
one sense this index measures the degree of geotechnical
engineering development of a particular region, but it needs to
be linked to the maximum and minimum of that region to
balance the asymmetries between different countries. The
following table shows the regional averages and their maximum
and minimum.
Table 2 - Average, maximum and minimum in each region
REGION
COUNT.
Members per million habitants
Average
Minimum
Maximum
AUSTRALASIA
2
64 Australia 40
New
Zealand 88
EUROPA
32
20 Russia 2.2 Iceland 77
NORTH
AMERICA
3
11 Mexico 2.5 Canada 21
SOUTH
AMERICA
13
3.5
Peru 0.9 Paraguay 9.5
ASIA
(**Without
Singapore and
Hong Kong)
22
6.0*
China 0.26
Singapore 42
2.7**
Japan 10.6
AFRICA
11
1.6 Nigeria 0.26 Tunisia 4.0
Volume 6 - Page 280