876
Proceedings of the 18
th
International Conference on Soil Mechanics and Geotechnical Engineering, Paris 2013
Table 1. Technical specifications of the centrifuge.
Diameter [m]
3.0
Radius of the swinging basket [m]
1.3
Maximum radial acceleration [g]
200
Maximum model weight [kg]
90
Maximum model height [cm]
56
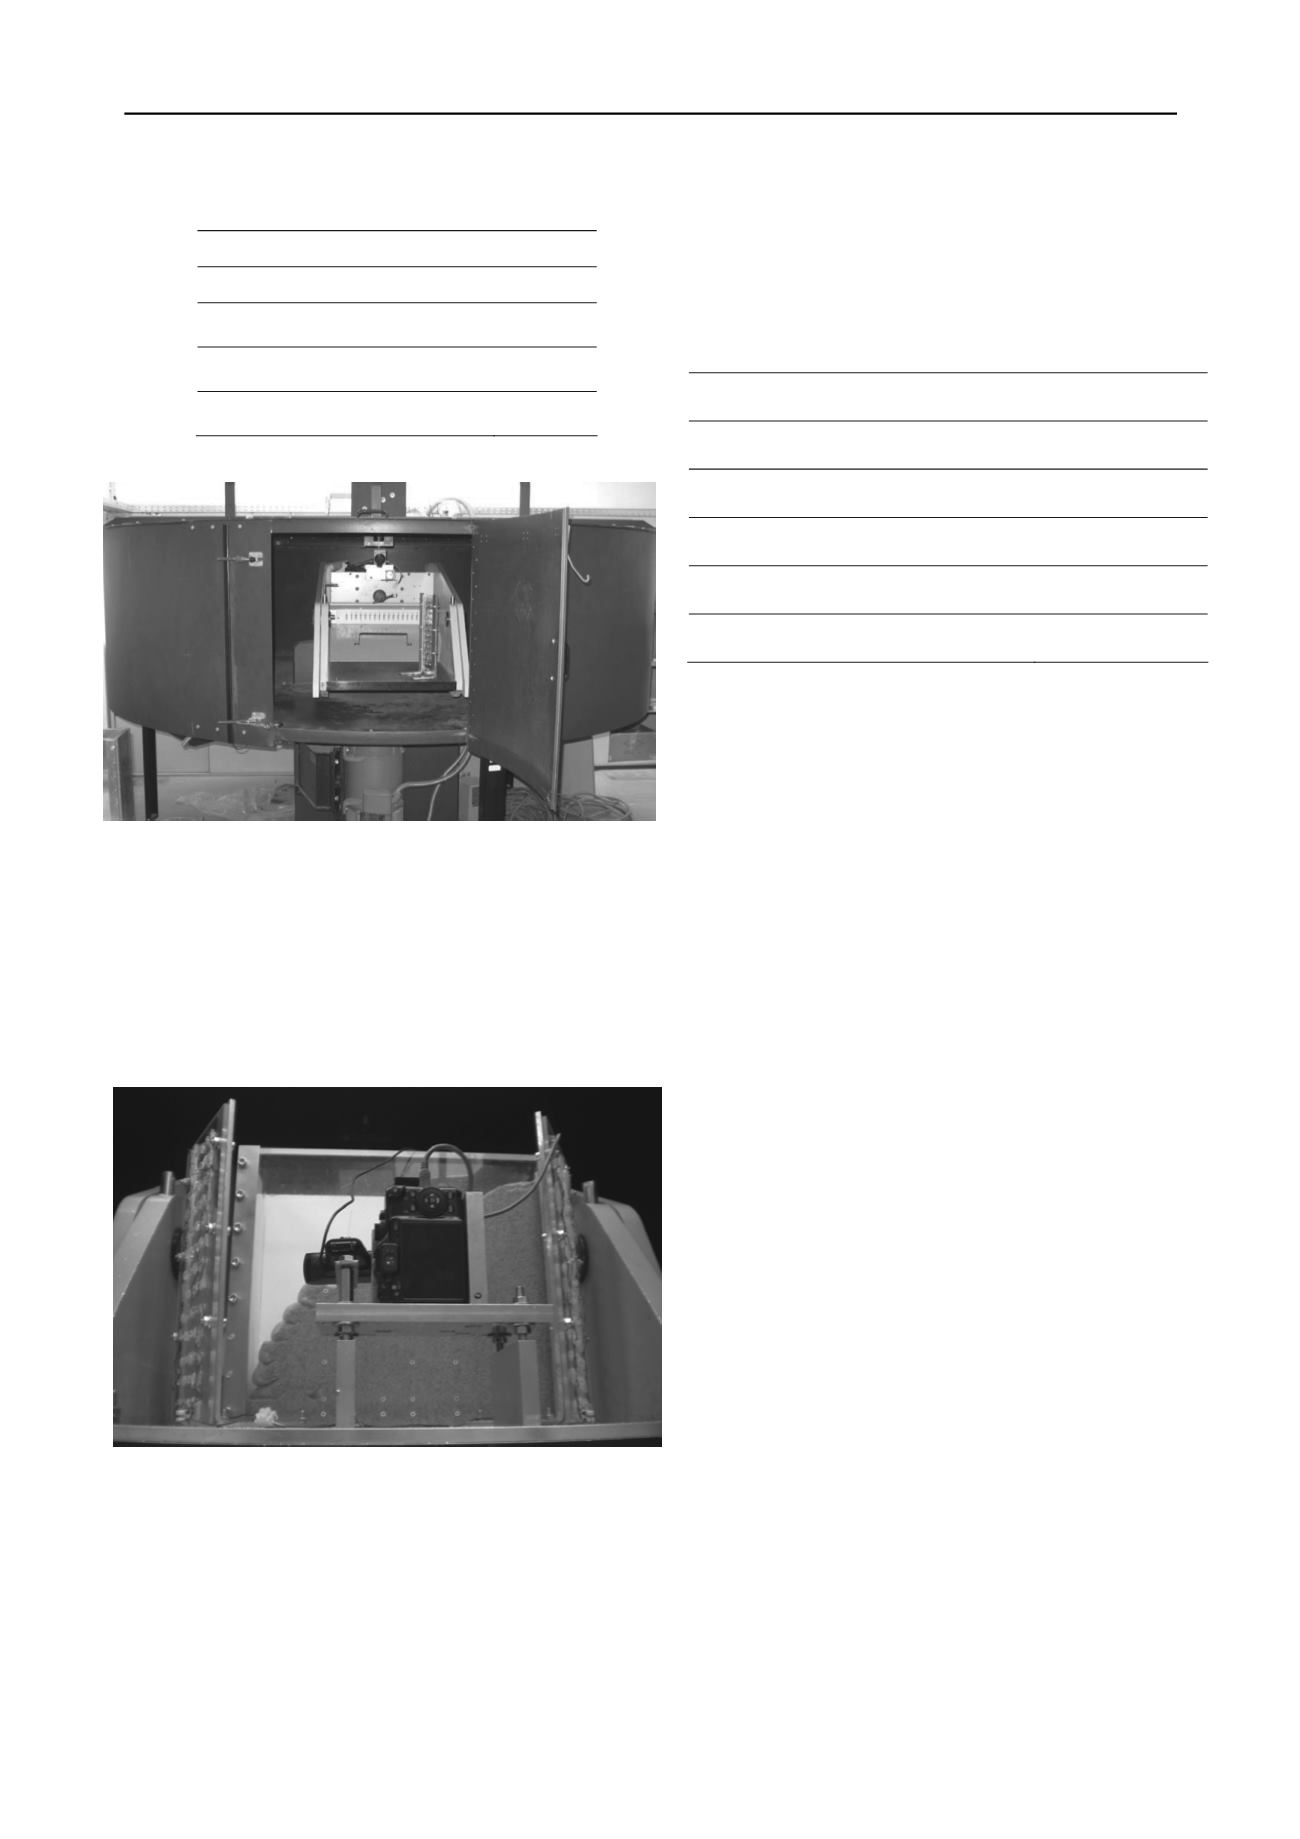
Figure 1. Photo of the centrifuge and its swinging basket.
2.2. Model box
The model box (Figure 2) has the dimensions of
440mm*400mm*155mm in depth. A transparent Plexiglas plate
with a thickness of 30mm was used on one side of the box to
enable digital images to be taken during testing. The other walls
of the box were aluminum plates with a thickness of 15mm. The
box is sufficiently rigid to maintain plane strain conditions in
the model.
Figure 2. Geotextile reinforced slope model with a digital camera in the
front and LED lights on the left and right sides.
2.3. Slope model and model textiles
Reinforced slope models have a slope inclination of about 65,
75, and 85 degrees. The geotextile reinforced slopes had the
same height of 270mm and was built on a soil layer of the same
properties. The slope models were loaded with a surcharge of
the same soil on the top of the slope. Due to the inherent
symmetry of the slope, only half of the slope was modelled.
2.4. Soil
The soil used in the experiments was uniform coarse sand
(Table 2), Standard Sand II (DIN 1164/58). The sand was not
compacted but each layer had the same weight for all three
models.
Table 2. Properties of soil
Specific weight ρ
s
[g/cm³]
2.644
Density range ρ
min
, ρ
max
[g/cm³]
1.44 – 1.65
Void ratio e
min
, e
max
0.607 – 0.844
Coefficient of uniformity
1.4
Friction angle φ [°]
34
Cohesion c [kN/m²]
0
2.5. Instrumentation
The displacement of the geotextile reinforced slope models
was measured by PIV (White et al. 2001; 2003). For this
purpose, a 14.7 MP Canon G10 digital camera was used to
obtain high resolution digital images of the sand grains behind
the Plexiglas wall. Black dots surrounded by white circles were
applied to the Plexiglas as can be seen in Fig. 2, and were used
as reference points for monitoring displacements within the soil.
Two panels of 33 LED lights were used on both sides of the
model box for lighting the centrifuge during testing. A laptop
computer was mounted close the rotating axis of the centrifuge
and connected to the main computer in the control room to save
the photos during centrifuge testing
.
2.6. Method
The soil displacement analysis was carried out with
GeoPIV8 software, developed by White & Take (2002). The
first image is divided into a grid of test patches. Each test patch
consists of a sample of the image matrix of size 20 * 20 pixels
and the images were captured in 6 s intervals until the failure of
the model. The recorded photographs are used to reveal the
failure mechanisms of the slope after testing.
3. RESULTS
The slope deformations before and after the slope failures
are evaluated with PIV analysis. The shear strain in the model
slopes with inclinations of 65, 75, and 85 degrees are shown in
Figures 3-5.
In Figures 3a and 3b, the slope has an inclination of 65
degrees. The failure surfaces can be clearly observed (Fig. 3b).
The failure surface does not pass through the toe as is often
observed in unreinforced slopes but emerges from the lower
part of the slope.
Figures 4a and 4b show the strain distribution in a steeper
slope with an inclination of 75 degrees. When compared with
the slope having an inclination of 65 degrees, the shear strains
especially in front of the shear surface are more pronounced
than in the previous slope (Fig. 4b).
Steeper slope (Figs. 5a and 5b) shows larger shear strain than
flatter slopes. Larger shear strain is observed not only in the top
of the slope but also along the whole surface of the slope (Fig.
5b).


